Journal of Occupational
Health and Epidemiology

Rafsanjan university Of medical sciences
Volume 11, Issue 3 (Summer 2022)
J Occup Health Epidemiol 2022, 11(3): 209-222 |
Back to browse issues page


Download citation:
BibTeX | RIS | EndNote | Medlars | ProCite | Reference Manager | RefWorks
Send citation to:


BibTeX | RIS | EndNote | Medlars | ProCite | Reference Manager | RefWorks
Send citation to:
sheikhmozafari M J, Ahmadi O. Reliability and Validity Assessment of the Persian Version of the Noise Exposure Questionnaire (NEQ): An NIHL Predictor Tool. J Occup Health Epidemiol 2022; 11 (3) :209-222
URL: http://johe.rums.ac.ir/article-1-526-en.html
URL: http://johe.rums.ac.ir/article-1-526-en.html
Related article in
Google Scholar
Google Scholar
Similar articles


1- M.Sc. in Occupational Health and Safety Engineering, Faculty of Medical Sciences, Tarbiat Modares University, Tehran, Iran.
2- Assistant Prof., Dept. of Occupational Health and Safety Engineering, Faculty of Medical Sciences, Tarbiat Modares University, Tehran, Iran. ,o.ahmadi@modares.ac.ir
2- Assistant Prof., Dept. of Occupational Health and Safety Engineering, Faculty of Medical Sciences, Tarbiat Modares University, Tehran, Iran. ,
Article history

Received: 2021/12/23
Accepted: 2022/08/13
ePublished: 2022/09/20
Accepted: 2022/08/13
ePublished: 2022/09/20
Subject:
Occupational Health
Full-Text [PDF 685 kb]
(1257 Downloads)
| Abstract (HTML) (3225 Views)
Table 1. Sound levels used for episodic noise activities discussed in the NEQ
.jpg)
Fig. 1. Overall computation of ANE values in L_Aeq8760h based on the answers obtained from the NEQ [14, 16].
EE= episodic exposure; EF= episodic frequency; EL= episodic level; RE= routine exposure; RF = routine frequency; RL= routine level. "Frequency", in the NEQ, refers to "the times an activity is performed".
Table 2. Questionnaire reliability results using alpha and ICC coefficients
Fig. 2 shows participation percentages reported by the participants for participating in 11 episodic activities as included in the NEQ (10 continuous noise activities and one impulse type noise activity). Listening to music through earphones and a device speaker had the highest participation rates with 91.4 and 85.7%, respectively. Besides, the use of aircraft with 2.8 % had the lowest participation rate.
Another parameter, even more important than the previous one, was the amount of the time spent in each activity. Table 4 shows the participants’ episodic frequencies. For this purpose, we grouped continuous episodic noise into general noisy recreational activities (power tools, equipment/ machinery, sports/ entertainment events, motorized vehicles, and aircraft), music-related activities, and occupational noise activities.
.jpg)
Fig. 2. Percentages reported by the individuals for participating in each of the 10 continuous noise activities and the impulse-noise activity, as discussed in the NEQ
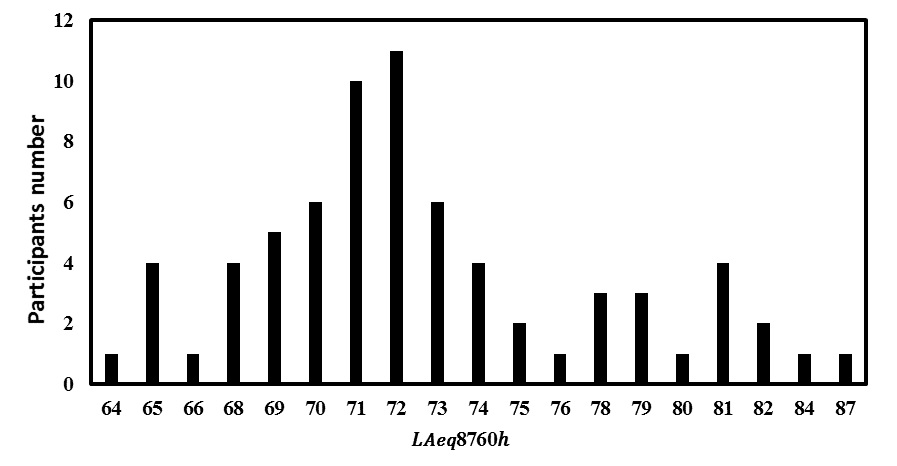
Fig. 3. Distribution of ANE values for the participants’
Table 5. The participants’ ANE by percentage and mean
Table 6. Participants meeting the highest NIHL risk criteria
Discussion
NEQ and ANE quantification: According to established standards, the permissible noise level for preventing NIHL or occupational hearing loss in working environments is 85 dB, or 90 dB in other standards. However, despite noise levels being under the permissible limit in many work environments, occupational hearing loss has been occurring to workers. Since occupational hearing loss is a cumulative process occurring over time, not being rooted in the workplace noise alone, many NIHLs must be considered and attributed to non-occupational noise outside the workplace. This magnifies harmful effects of noise in work environments. For instance, one study found that people listening to loud music through a headset had a significantly worsened hearing threshold, which increased the risk of hearing loss [30]. The NEQ is one of the most comprehensive questionnaires employed to assess occupational and non-occupational noise exposures over the past year among all individuals. Using the NEQ, we could determine which individuals were at the highest NIHL risk. In this study, for the first time in Iran, we provided the Persian version of the NEQ questionnaire using the backward-forward method. Next, we distributed the questionnaire among 70 employees of an oil company in Assaluyeh City, Bushehr Province. In addition, we used Cronbach's alpha and ICC methods to evaluate reliability. In examining the history of occupational and non-occupational noise exposure, this questionnaire has a major advantage. Accordingly, the people were not only asked to report their participation in noisy activities, but they were also asked to quantify the amount of the time spent in these activities and the amount of the time spent using hearing protection devices (HPDs) when participating in such activities. In other words, using the NEQ, the expert could quantify the individual annual noise exposure (ANE) dose for occupational and non-occupational noises in less than 10 minutes to diagnose NIHL. In general, the concurrent increasing of the sound level and the duration of each activity increased the participants’ NIHL risk. In this study, Kappa and Spearman's coefficients were calculated at 0.639 (a minimum of 0.340 and a maximum of 1) and 0.80 (a minimum of 0.514 and a maximum of 1), respectively, indicating a good agreement and a high correlation between the employees' answers [31]. Besides, concerning questionnaire validation, Cronbach's alpha and ICC coefficients were calculated at 0.918 and 0.856, respectively. In the studies of Susan and Johnson, validity of this method was established [16, 22]. In the study of Han et al, reliability of the questionnaire using the Cronbach's alpha method was calculated at 0.799; in addition, the ICC method showed that all questions were within an acceptable range [24]. According to Fig. 2, listening to music through earphones and a device speaker had the highest participation rates of 91.4 and 85.7%, respectively. Based on the findings of this investigation, listening to music through earphones or headsets had the highest participation rate of 91.4%. This indicates that an activity of a high participation frequency (an average of 160 hours/year) but at a low sound level (76 dB), general recreational activities, and noisy work activities had the least participation frequency (the average of both being 65 hours). However, listening to music through earphones or headsets accounted for only 1.79% dose in calculating a participant's overall ANE. In the studies of Johnson, Susan, and Han, the item of listening to music via earphones or headsets had the highest participation rate [16, 22, 24]. On the other hand, using "aircraft" had the lowest participation rate with 2.8% (an average of 5.30 hours/year), but the use of "aircraft" had a high noise level of 91 . Accordingly, exposure to aircraft noise only contributed 1.88% dose to an individual’s overall ANE. In the study of Han, the use of motorized vehicles had the lowest participation rate [24]. The data obtained from this study suggested that the participants had performed activities of high sound levels over the past year. In this study, the activity of the use of "motorized vehicles" had the highest dose (36.62%) which contributed to the total ANE. The mean in this study was 73 dB for all participants (Table 5), being consistent with in many similar studies [14, 16, 22, 32]. According to the findings of the present study, when we used standards and , 17.14 and 70% of the participants were at a high risk of developing NIHL, respectively. Besides, when we used the 79 dB criterion, fewer people were at the high risk of NIHL than EPA. In Johnson's study, these values were 32 and 75%, respectively [16]. In the study of SA Hlousek et al, conducted on people using the NEQ questionnaire, it was found that 71.2 and 89% of the participants were at the highest risks of NIHL, according to the NIOSH and EPA standards, respectively [33]. As already mentioned, one of the major purposes of the NEQ is to estimate an individual’s one-year history of total noise exposure and their NIHL risk. However, there are some disadvantages, apart from advantages, in using this method. Among the disadvantages of the NEQ, one can refer to its high dependence on participants’ ability to recall noisy activities they performed in the past year to compute their ANE and NIHL. Besides, it relies on typical sound levels reported in other studies, with this producing an error as sound pressure levels could be different depending on workplace features. Additionally, it considers only the last 12-month activities to assess annual noise exposure. Furthermore, it only identifies people who are at the risk of NIHL, yet it cannot identify people who have hidden hearing loss (HHL); moreover, it does not consider the relationship between demographic factors and NIHL [16, 24]. Despite the mentioned limitations, the method used in this study had been validated in other studies; in fact, this method considers episodic noise activities and routine/daily noise activities together [14, 16, 35]. Another advantage of this questionnaire was that due to the COVID-19 pandemic, it was difficult to obtain a permit to enter the workplace, so we used the questionnaire. However, upon using this questionnaire and reference sound pressure levels mentioned in the valid studies, we were able to accurately evaluate the participants’ non-occupational noise exposure without measuring the sound pressure level.
This questionnaire had a question about impulse-noise exposure (question 12), which was related to the use of firearms, yet it was not included in the final calculation of ANE. However, firearms have a very high sound level that is very dangerous to the hearing system and significantly increases NIHL; thus, people with such exposure must be considered in terms of NIHL [16, 22]. Although we considered neither HPDs nor gunfire noise exposure to calculate ANE, these two specific items in the NEQ provided significant information to the audiologist and other professionals on the NIHL risk. In this study, 13% of the participants reported the experience of gunfire noise exposure, but only 11% of them utilized HPDs while using firearms. Several other studies reported the same results about not using HPDs while using firearms [16, 22]. Based on the findings of the present study for questions 7, 8, 9, 10, 12, 13, 16, and 17, a total of 26, 15, 8.6, 12.9, 11, 1.4, 72, and 69% used HPDs, respectively; however, regarding question 11, nobody used HPDs. Findings of the use of HPDs showed that the participants often used HPDs when they were exposed to occupational noise. As a reason, the use of HPDs in the workplace is compulsory. Besides, individuals are relatively aware of occupational noise dangers, so they require themselves to use HPDs. However, as they are not aware of the dangers of non-occupational exposure, they will not use HPDs if they do not have to. By assessing the participants' responses to how often they use HPDs for different episodic noise activities, hearing professionals could more appropriately give counsel on the need for adding, modifying, or continuing HPD use [16].
Screening individuals at the high risk of NIHL: Validating the 1-Minute Noise Screening method and predicting the NIHL score of the participants using that method were among the goals of this research. According to Johnson’s study, out of six questions, only the first three ones gained the required score and were able to properly identify high-risk noise exposure. However, the other three questions about hearing symptoms were eliminated due to noise exposure. This was because, firstly, they were unable to correctly predict the NIHL score, and secondly, this was because NIHL is one of the leading causes of inner ear damage and is often associated with hearing and ear symptoms [16]. The three remaining questions were about the use of firearms (question 1), noisy jobs (question 2), and other loud (recreational) noises (question 3). However, we evaluated the first three questions of the screening method in NIHL assessment. In fact, its validation using the mentioned methods as well as its kappa and Spearman’s coefficients showed desirable results. The results for Cronbach's alpha and ICC coefficients for the first six questions were 0.93 and 0.87, respectively. In addition, the kappa and Spearman's coefficients were calculated at 0.690 and 0.793, respectively. However, to use the 1-Minute Noise Screening method for the participants, we had to use the criteria mentioned in the Johnson’s study; thus, we used only the first three questions for participant assessment. The three questions (1, 2, 3) included in the main final questionnaire showed a high degree of accuracy ( ) in the study of Johnson et al [16]. Temporary threshold shift (TTS) and tinnitus (questions 4 and 5) were reported more frequently in NIHL studies [16, 36]. On the other hand, earache or a sense of fullness in the ears (questions 6) were more or less reported in studies as a possible symptom of noise exposure [16, 37]. In this study, for the screening method, a score between 0 and 4 and score 5 or higher were considered low and high risks, respectively. In addition, 22 (about 31.5%) and 48 participants (68.5%) had a score of 0 to 4 and 5 or higher, respectively. As already mentioned, according to the NIOSH and EPA standards, 17.14 and 70% of the people in this study were at the high risk of NIHL, respectively. Based on the results obtained from the screening method, 68.5% of the people were at a high risk, indicating that this method worked well in identifying people at a high risk of NIHL.
Individuals were not easily accessible in this study, having been one of its limitations. In addition, the low enthusiasm of the participants for participating in the study and COVID-19 constraints were the other limitations. Accordingly, it is suggested that similar methods and questionnaires be used in future studies with different groups to better understand strengths and weaknesses of this method.
Conclusion
The results of the present study showed that the NEQ helped us calculate annual non-occupational noise exposure levels leading to NIHL. In addition, using that questionnaire, we could estimate the proper time for providing the participants with HPDs to avoid NIHL. Another achievement of the present study was that in the case of the lack of time, the 1-Minute Noise Screen could be used by professionals to identify people at a high risk of NIHL in the workplace. However, it must be mentioned that this method has probably lower accuracy than the extended version of the NEQ. In addition to occupational health
professionals, hearing healthcare professionals as well as audiologists can use this tool to address the need for hearing protection programs for people at a high risk of NIHL.
Acknowledgement
The authors of this study would like to extend their gratitude to Mr. Mohammad Heidar Rafiei, the senior safety engineer at the oil company in Assaluyeh, who kindly and patiently assisted us with distributing and collecting the questionnaires, as well as briefing the Assaluyeh staff on the goals and stages of this study.
Conflict of interest: None declared.
Full-Text: (608 Views)
Introduction
The galloping urbanization and industrialization of processes have led to producing highly dangerous pressure levels of sounds [1]. High level noise exposure is one of the most prevalent workplace hazards in the world [2], with the most well-known harmful effect of noise being hearing loss [3]. Noise exposure can expose a person to many dangers, such as irritability, heart disease, high blood pressure, diabetes, etc. [4]. Researchers have estimated that 26 million adults in the US have permanently damaged their hearing system due to noise exposure. The World Health Organization (WHO) estimates that 10% of people are at the risk of NIHL due to harmful sound pressure levels worldwide, with 16% of which found to be associated with occupational noise [5]. In Europe, 30% of the workforce were reported to be experiencing very high levels of noise in the workplace [6]. Long-term noise exposure can trigger a hearing disorder called noise-induced hearing loss (NIHL) [7]. NIHL accounts for more than 16% of hearing loss cases in adults [8]. Research in Germany and other industrialized countries show that 12 to 15% of all workers experience loud noises causing NIHL [9]. Although NIHL is a preventable occupational disease, it is one of the top 10 occupational diseases in the US, Canada, and other countries [10]. Some work environments have very high noise levels. According to a report, 22 million workers in the US reported exposure to hazardous workplace noise levels, with about 82% of NIHL cases occurring to workers in various industries [11]. According to a study conducted by Thepaksorn et al, the NIHL prevalence rate among people working in the wood industry was over 22.8% [12]. In a five-year study, Miri et al identified a rise in the average hearing threshold at various frequencies among employees working in the steel industry [10]. In many industries, the link between noise and hearing loss has been strongly established [12]. Although noise exposure and NIHL incidents are the most common occupational exposures and diseases in the world, they are currently the most preventable adverse elements in the workplace [3]. Qualitative noise assessment is a technique employed to avoid NIHL. Although there is the possibility that noise may have standard sound pressure levels in the workplace and that it may not be considered dangerous to workers, it can qualitatively create annoying conditions for workers [13]. Two issue must be kept in mind while dealing with NIHL; firstly, non-occupational noise exposure along with noise exposure must be considered in the workplace because they are primary causative factors for NIHL; thus, we must always consider non-occupational exposure while examining NIHL; secondly, objective and quantitative measurements of noise using measurement devices cannot always give us an accurate estimate of NIHL risks to individuals; hence, we must always consider qualitative non-occupational noise exposure assessment [14,15]. One of the methods of quantifying occupational and non-occupational noise exposure is to use relevant questionnaires to identify people at NIHL risks [16]. In this respect, the Noise Exposure Questionnaire (NEQ) is one of the most reliable questionnaires [16-18]. Accordingly, we used this questionnaire in the present study to collect information, yet we had to check validity and reliability of the questionnaire beforehand [19]. Therefore, to validate the questionnaire in a population speaking another language, there is a need for cross-cultural matching and validation [20]. The Noise Exposure Questionnaire (NEQ) is used for quantifying noise exposure, which was developed in 2017 by Johnson et al to estimate annual non-occupational (music, traffic, vehicle, airplane noise, etc.) and occupational noise (noise existing in the work place) exposures among individuals [16, 21]. A study verified internal consistency, intra-participant reliability, and intra-test reliability of this questionnaire [16]. Similarly, Susan verified validity of this questionnaire [22]. This questionnaire has been translated from English to the Malaysian and Chinese languages [23, 24]. Stamper used the NEQ to quantify data on 30 individuals with normal hearing loss, who were exposed to different levels of background noise [25]. In his study using this questionnaire, Johnson found that participants in the past year were exposed to loud occupational and non-occupational noises in certain activities. Although the participation rate in Johnson's study was high, ANE (annual noise exposure) estimates were below the highest-risk levels for many participants because the participation frequency in these activities was low [16]. Athirah et al used the NEQ to collect information on occupational noise exposure among airline employees; accordingly, they found out that a high percentage of individuals were at the risk of hearing loss due to their working conditions. Ridley et al conducted a study to assess the estimated hidden hearing loss (HHL) of individuals using NEQ in order to survey the history of noise exposure in the past year [18]. Taylor used the NEQ, in his PhD dissertation, to assess occupational and non-occupational noise exposure among individuals [26]. Kun validated the Chinese version of the NEQ and proved its high reliability [24].
About 20% of the world population live with hearing loss. Given the hazardous effects of noise on workers, especially in Iranian workplaces, the main reason for the present work was to create a task-based tool for evaluating the annual noise exposure history among workers and other populations by surveying occupational and non-occupational exposures. This tool may be utilized by clinicians and other researchers to identify people with the highest NIHL risks. The next objective was to design derivative questions from the original questionnaire to be used for screening people at a higher NIHL risk within the shortest time possible.
Materials and Methods
In brief, this project has two steps; firstly, to assess reliability of the Persian version of the NEQ among workers of an oil company in Iran; secondly, to appraise the application of the NEQ in research on noise and occupational care to prevent NIHL prevalence for predicting hearing loss scores among the company's employees and determining high-risk people.
Accordingly, the present study aimed to determine validity and reliability of the Persian version of the NEQ in an Iranian oil company in Assaluyeh City in 2021. To this end, ethical approval was received under code IR.MODARES.REC.1400.114.
Translation of the questionnaire from the original language into the Persian language: To use an original language questionnaire, two steps must be taken [19]. Firstly, linguistic validity of the questionnaire must be determined by translating the questionnaire from the original language into the Persian language. Secondly, psychometric aspects of the questionnaire must be examined. Linguistic validation and psychometric validation include the processes of translating and cross-cultural adaptation of a tool into the target language so that it remains conceptually and semantically equivalent to that of the source version. Both these phases are necessary to ensure that translated and original versions are equivalent. Accordingly, in the first step, the original questionnaire must be translated to determine its linguistic validity. There are two ways to translate any questionnaire from the original language into another language, which include forward-backward (FB) dual-panel (DP) methods [27]. To test linguistic validity, the original questionnaire was translated into the Persian language from English using the forward-backward technique [28]. There are four main steps to use this technique. Firstly, the questionnaire must be translated (forward) from the original language into the Persian language by two independent translators; secondly, the two translated versions must be integrated into a single version by the same forward translators; thirdly, two other translators must perform the secondary or back translation (backward) of the combined translated version from the Persian language into the original language; fourthly, an experienced expert team familiar with the context of the questionnaire must review primary and secondary translated versions and match them with the original version to ensure that the two questionnaires have the same semantic load and linguistic validity.
The NEQ asks the respondents to recollect specific noisy activities they performed in the previous year.
NEQ questionnaire: The NEQ consisted of the three parts of (a) demographic information (gender and age, (b) six potential screening questions to identify persons with high-risk noise exposure (questions 1 to 6), and (c) 11 specific questions about participation in noisy activities to calculate Annual Noise Exposure (ANE) (questions 7 to 17) [14]. The NEQ was based on the task-based questionnaire described in the study by Neitzel et al [14], yet it differed from several aspects. Questions 16 and 17 were related to occupational noise exposure (at the free time or during a work year), which were added to this questionnaire. In addition, questions relating to playing a musical instrument (question 13) and listening to music via earphones (question 14) or speakers (question 15) were integrated. The reason for integrating those questions was that Neitzel who developed original and primary versions of the questionnaire used in his study did not mention these items in his version. Thus, Johnson et al (the present study being based on the questionnaire used in their study) added these questions to their version to complete the questionnaire. Finally, response options were added to each question to check average hours that each noisy activity lasted.
Participants: Since the purposes of the present research were to validate the Persian version of the NEQ in the Persian language and to predict the participants’ NIHL scores, we explained the purpose and method of the research to the employees of an oil company in Assaluyeh City, Bushehr Province. There were 89 male workers in this workplace, who worked in the production line. Using the Cochran’s formula, the sample size was determined at 73. The participants participated in this study voluntarily and upon personal consent. Among the questionnaires distributed to 73 participants, 70 questionnaires were completely answered by them. The participants’ average age was 36.55. Besides, 28 were day-shift workers, and 42 were workers of other shifts. The people’s average work experience was 10 years. The inclusion criteria were having at least one year of work experience and not having congenital hearing loss; on the other side, the exclusion criteria were having drug abuse, taking specific medicines, having a mental illness, and completing the questionnaire incompletely.
ANE estimation: We performed ANE estimation based on Neitzel's study [14]. Accoridngly, we calculated episodic (occasional) and routine (daily) exposures separately. Next, we combined them to calculate the overall ANE. Episodic exposure activities included the use of power tools and heavy machinery, attending sports and entertainment events of loud noises, and playing or listening to music. In contrast, routine (daily) exposure activities included daily activities not associated with high risk noise exposures, such as sleeping, studying, working with a computer, traveling by bus or by car, and shopping. We obtained the participation frequency for each episodic noise activity from the participants' answers to the NEQ. Next, we extracted the representative sound level for each of the episodic exposure activities by reviewing past research. Besides, we used the study by Neitzel et al for the activities mentioned in the study of Neitzel et al [14]. Other authoritative studies mentioned in Johnson’s study were used for activities not mentioned in Neitzel’s study [16]. Unfortunately,
due to the COVID-19 pandmics at the time of this research and strict workplace restrictions, it was not possible to enter the workplace to measure noise levels manually. Thus, we had to extract standard noise levels from authentic studies. This method was used in the studies of Neitzel and Johnson as well [14, 16], with its use being increasing day by day in quality assessment studies, like the present one.
Table 1. Sound levels used for episodic noise activities discussed in the NEQ
| Question | Noise activity category and activity description | Representative (dBA) levels | Reference |
| 7 | Power tools: using power tools, chainsaws, and other workshop tools outside working hours | 94 | (14, 16) |
| 8 | Machinery and equipment: driving and using heavy machinery (tractors, trucks, agricultural equipment, and lawn mowers) outside working hours | 97 | |
| 8 | Sports and entertainment events: participating in sports and car racing, school sports events, commercial events, music concerts/dances, as well as other activities and events with amplified public announcement music systems | 94 | |
| 10 | Motorized vehicles: driving or working with motor vehicles, such as motorcycles, jet skis, high-speed motorboats, four wheelers, and snowmobiles | 98 | |
| 11 | Aircraft: driving small aircraft and private airplanes | 91 | |
| 13 | Musical instruments: playing a musical instrument | 87 | (16) |
| 14 | Music (earphones): listening to music, radio programs, etc. using a personal headset or earphones | 76 | |
| 15 | Music (a device's own speaker): listening to music, radio programs, etc. from device speakers at home or in the car (other than music concerts and earphones) | 78 | |
| 16, 17 | Occupational noise: performing a noisy job in summer or in a school year | 90 | |
| Note: the impact-type noise in question 12 cannot be considered in calculating annual exposure | |||
| 12 | Firearms: being around or shooting firearms, such as rifles, pistols, and shotguns | Not applicable (impact noise cannot be integrated into ) | |
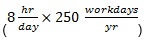
In this study, we calculated the employees’ annual exposure based on . The total duration of the noise exposure was 8,760 h.
Formula 1.
.jpg)
In the above equation, hr, day, and year stand for "hour" "day" and "year" respectively.
Using the equation recommended by the NIOSH and the method used by Neitzel et al, the following equation was used for each of the continuous-noise exposure activities required in the NEQ (questions 7 to 11 and 13 to 17), and also for routine (daily) exposure activities:
The participants' response frequency (the participation duration in each activity) in the NEQ was assigned as "daily" = 200, "weekly" = 50, "monthly" = 12, "every few months" = 1, and "never" = 0. Similarly, for duration-related responses, the items of "more than 8 hours" = 8, "between 4 and 8 hours" = 6, "between 1 and 4 hours" = 3, and "less than 1 hour" = 1 were set. Next, we calculated episodic frequency (C-value) through multiplying participants’ frequencies by durations.
Formula 2.
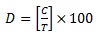
In this equation, C represents the number of hours/year reported by the individuals in an activity.
Letter C for routine (daily) exposure activities is the result of subtracting the combined episodic values obtained for each episodic exposure from 8,760. There was the possibility that the participants could not accurately recall their activities to calculate their actual exposure levels, like through dosimetry. To answer this question, Reeb-Whitaker et al evaluated the correlation between exposure levels obtained via a task-based recall questionnaire of workplace activities occurring six months beforehand and dosimetry measures taken from those participants on the same day. Although the sound level estimates obtained from both the task-based recall and dosimetry were not the same, the difference between the two exposure-level estimates was approximately 2 dB. Based on these findings, the assumptions of this study are based on the fact that the NEQ can estimate the ANE virtually and precisely [16].
The NEQ surveyed another episodic activity (question 12) whose value was not included in the calculation of D. This question, being related to the activity of using firearms (rifles, pistols, shotguns, etc.) was related to impulse-noise exposure. Since there was no way to integrate impulse-noise exposure into continuous noise exposures discussed in the other questions, firearm exposure was not included in the dose calculation, which must be considered and described separately as follows:
Formula 3.

Where T indicates the number of hours/year in which the activity is considered dangerous, obtained using the REL standard over a one-year period.
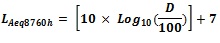
Accordingly, we calculated 10 episodic exposure doses and one routine exposure dose. Next, individual doses were arithmetically added to each other to calculate the final ANE dose. The total dose (D) was then used in the following equation to calculate the ANE:
Formula 4.
Formula 1.
In the above equation, hr, day, and year stand for "hour" "day" and "year" respectively.
Using the equation recommended by the NIOSH and the method used by Neitzel et al, the following equation was used for each of the continuous-noise exposure activities required in the NEQ (questions 7 to 11 and 13 to 17), and also for routine (daily) exposure activities:
The participants' response frequency (the participation duration in each activity) in the NEQ was assigned as "daily" = 200, "weekly" = 50, "monthly" = 12, "every few months" = 1, and "never" = 0. Similarly, for duration-related responses, the items of "more than 8 hours" = 8, "between 4 and 8 hours" = 6, "between 1 and 4 hours" = 3, and "less than 1 hour" = 1 were set. Next, we calculated episodic frequency (C-value) through multiplying participants’ frequencies by durations.
Formula 2.
In this equation, C represents the number of hours/year reported by the individuals in an activity.
Letter C for routine (daily) exposure activities is the result of subtracting the combined episodic values obtained for each episodic exposure from 8,760. There was the possibility that the participants could not accurately recall their activities to calculate their actual exposure levels, like through dosimetry. To answer this question, Reeb-Whitaker et al evaluated the correlation between exposure levels obtained via a task-based recall questionnaire of workplace activities occurring six months beforehand and dosimetry measures taken from those participants on the same day. Although the sound level estimates obtained from both the task-based recall and dosimetry were not the same, the difference between the two exposure-level estimates was approximately 2 dB. Based on these findings, the assumptions of this study are based on the fact that the NEQ can estimate the ANE virtually and precisely [16].
The NEQ surveyed another episodic activity (question 12) whose value was not included in the calculation of D. This question, being related to the activity of using firearms (rifles, pistols, shotguns, etc.) was related to impulse-noise exposure. Since there was no way to integrate impulse-noise exposure into continuous noise exposures discussed in the other questions, firearm exposure was not included in the dose calculation, which must be considered and described separately as follows:
Formula 3.
Where T indicates the number of hours/year in which the activity is considered dangerous, obtained using the REL standard over a one-year period.
Accordingly, we calculated 10 episodic exposure doses and one routine exposure dose. Next, individual doses were arithmetically added to each other to calculate the final ANE dose. The total dose (D) was then used in the following equation to calculate the ANE:
Formula 4.
Fig. 1. Overall computation of ANE values in L_Aeq8760h based on the answers obtained from the NEQ [14, 16].
EE= episodic exposure; EF= episodic frequency; EL= episodic level; RE= routine exposure; RF = routine frequency; RL= routine level. "Frequency", in the NEQ, refers to "the times an activity is performed".
Neitzel and Johnson, in their studies, fully described the methods we used in the present study [14, 16].
Determination of NIHL Risks: For occupational cases, NIOSH REL is . This limit represents the risk to hearing from exposure to occupational noise in a normal work year.
Formula 5.
To calculate annual exposure and after considering both occupational and non-occupational sound sources, it was necessary to consider a whole year or 8,760 hours (24 hours/day × 365 days/year) [14, 16]. The U.S. Environmental Protection Agency (EPA) recommends an annual exposure limit of 70 dBA for preventing hearing disorders [16]. One of the purposes of this study, in addition to validating the Persian version of the NEQ, was to screen the participants with the highest NIHL risk. Hence, we proceeded based on the NIOSH (1998) occupational noise limit of . Given the 3-dB exchange rate recommended by the NIOSH, we used an annual equivalent exposure limit of in this study [16]. To accomplish the goals of the present study, we considered the participants with values 79 to be at the highest risk of developing NIHL. It should be noted that this formula can be used in both professional and non-professional noise exposures [15].
The 1-Minute Noise Screening method for rapidly identifying individuals at the NIHL risk: The 1-Minute Noise Screening method for noise exposure consisted of six monitoring questions (1 to 6) to predict high-risk noise exposure. The first three questions (1 to 3) were related to shooting with a gunfire, performing noisy work, and doing a noisy activity, such as using power tools and garden equipment, as well as listening to music. In some studies, the highest-risk NIHL has been considered for occupational sources and gun noise [14, 16]. The next three questions (4 to 6) were related to physiological symptoms associated with noise exposure, including tinnitus, Temporary Threshold Shift (TTS), pain, and hearing discomfort after exposure to loud noises. To give a score to these options, we assigned 0, 1, 2, 3, and 4 to "never", "every few months", "monthly", "weekly", and "daily", respectively, and added them together to determine the final NIHL risk score. In Johnson’s study, the analysis showed that this method was effective in identifying people at the
highest risk of developing NIHL [16].
In the present study, we employed Cronbach's alpha and the test-retest method (the intra-class correlation coefficient (ICC)) for questionnaire validation. Regarding the test-retest method, the participants completed the questionnaires at two different times under similar conditions. The ICC ranged from 0 to 1, and the final number obtained indicated reliability of the questionnaire. Besides, using the kappa and Spearman’s correlation coefficients, we validated the individuals’ answers that were given at the first and second times. In addition, the entire data analysis was performed in SPSS V22.0.
Results
Questionnaire validation: In this descriptive-analytical study, 70 questionnaires were collected. The participants’ average age was 36.55 with a standard deviation of 5.41, indicating that the study population was young. A total of 28 out of the entire population (n = 70) were day-shift workers, and 42 were workers of other shifts. Reliability values of this questionnaire using the alpha and ICC coefficients were 0.918 and 0.856, respectively. Table 2 shows reliability results of the questions using the alpha and ICC coefficients.
It is worth noting that questions 16 and 17 were somehow limited to yes and no answers, so determining their reliability did not significantly affect their overall reliability score.
To assess the consistency and correlation of the answers given by the participants for the first and second series of questions distributed, we used the kappa and Spearman’s coefficients (Table 3).
We found that the employees’ NIHL risk had a significant correlation with their working duration per week and type of work shift. Besides, there was a significant correlation between questions 5 (TTS) and 6 (other hearing symptoms) with the individuals’ ANE; however, there was no correlation between question 4 (tinnitus) and ANE. The translations were combined and the review was performed by the experts. Accordingly, the results of linguistic and psychometric validation showed that out of 17 questions, one question from the first part (questions 1 to 6) and two questions from the second part (7 to 17) were semantically and conceptually different from the original questionnaire. Therefore, we repeated the whole process for them and finally obtained the desirable validity.
Participation in episodic noise activities: By analyzing the data obtained from the NEQ, we collected information on the individuals’ exposure to noise sources and activities over the past year. Accordingly, Fig. 1 and Table 4 summarize the data for the study population.
Table 2. Questionnaire reliability results using alpha and ICC coefficients
| Question | Alpha | ICC |
| No. 1 and 12: Being involved with firearms or shooting with them | 1 | 1 |
| No. 2: Being exposed to loud sounds while working | 0.896 | 0.812 |
| No. 3: Being exposed to other loud sounds | 0.986 | 0.973 |
| No. 4: Being exposed to loud noises causing your ears to ring or buzz | 0.944 | 0.893 |
| No. 5: Being exposed to loud sounds making your hearing muffled | 0.772 | 0.629 |
| No. 6: Being exposed to loud noises causing your ears to get hurt and feel full, or somehow bothering you | 0.936 | 0.879 |
| No. 7: Using power tools, chainsaws, or other workshop tools | 0.874 | 0.776 |
| No. 8: Driving heavy equipment or using noisy machinery (tractors, trucks, etc.) | 0.873 | 0.774 |
| No. 9: Attending events with amplified public announcement/music systems | 0.788 | 0.650 |
| No. 10: Riding/operating motorized vehicles (motorcycles, jet skis, etc.) | 0.983 | 0.967 |
| No. 11: Riding or piloting small aircraft/private airplanes | 0.937 | 0.881 |
| No. 13: Playing musical instruments | 0.889 | 0.800 |
| No. 14: Using personal headsets or earbuds to listen to music, radio broadcasts, etc. | 0.938 | 0.882 |
| No. 15: Listening to music, radio broadcasts, and other audio contents through audio speakers in a car or at home | 0.960 | 0.923 |
Table 3. Validation of the answers given by the participants for the first and second series questions
| Question | Consistency of the questions (kappa test) |
Correlation between questions (spearman’s coefficient) |
| No. 1 and 12: Being involved with firearms or shooting with them | 1 | 1 |
| No. 2: Being exposed to loud sounds while working | 0.681 | 0.708 |
| No. 3: Being exposed to other loud sounds | 0.815 | 0.962 |
| No. 4: Being exposed to loud noises causing your ears to ring or buzz | 0.712 | 0.923 |
| No. 5: Being exposed to loud sounds making your hearing muffled | 0.595 | 0.650 |
| No. 6: Being exposed to loud noises causing your ears to get hurt and feel full, or somehow bothering you | 0.340 | 0.514 |
| No. 7: Using power tools, chainsaws, or other workshop tools | 0.643 | 0.847 |
| No. 8: Driving heavy equipment or using noisy machinery (tractors, trucks, etc.) | 0.762 | 0.784 |
| No. 9: Attending events with amplified public announcement/music systems | 0.634 | 0.681 |
| No. 10: Riding/operating motorized vehicles (motorcycles, jet skis, etc.) | 0.622 | 0.990 |
| No. 11: Riding or piloting small aircraft/private airplanes | 0.615 | 0.994 |
| No. 13: Playing musical instruments | 0.483 | 1 |
| No. 14: Using personal headsets or earbuds to listen to music, radio broadcasts, etc. | 0.651 | 0.808 |
| No. 15: Listening to music, radio broadcasts, and other audio contents through audio speakers in a car or at home | 0.667 | 0.884 |
Table 4. Episodic frequency (EF) and routine frequency (RF) based on hours/year
| Activity grouping (continuous noise) | Range | 10th percentile | 50th percentile | 90th percentile | Mean |
| Episodic activities | |||||
| General recreational activities (questions 7 to 11) | 0-1872 | 0 | 2 | 122 | 65 |
| Music-related activities (questions 13 to 15) | 0-3000 | 0 | 200 | 740 | 330 |
| Occupational noise activities (questions 16 and 17) | 6-154 | 33 | 64 | 100 | 65 |
| Overall EF: Combined numbers of hours/year for all continuous episodic activities | 0-1200 | 0 | 1 | 150 | 45 |
| Routine activities | |||||
| Overall RF: Number of hours/year spent in routine (daily) non-noisy activities (calculated for each participant by subtracting the participants’ EF from the total 8,760 hours per year) | 7560-8760 | 8610 | 8759 | 8760 | 8716 |
Fig. 2 shows participation percentages reported by the participants for participating in 11 episodic activities as included in the NEQ (10 continuous noise activities and one impulse type noise activity). Listening to music through earphones and a device speaker had the highest participation rates with 91.4 and 85.7%, respectively. Besides, the use of aircraft with 2.8 % had the lowest participation rate.
Another parameter, even more important than the previous one, was the amount of the time spent in each activity. Table 4 shows the participants’ episodic frequencies. For this purpose, we grouped continuous episodic noise into general noisy recreational activities (power tools, equipment/ machinery, sports/ entertainment events, motorized vehicles, and aircraft), music-related activities, and occupational noise activities.
Fig. 2. Percentages reported by the individuals for participating in each of the 10 continuous noise activities and the impulse-noise activity, as discussed in the NEQ
Participation in routine activities: As already mentioned, Table 4 shows a summary of the information on routine daily none-noisy activities. Among these activities, one can refer to studying, using the TV and computers, traveling by bus and car, shopping, eating in a quiet restaurant, spending time at home, eating, sleeping, and the like [16]. As Table 4 shows, the total RF of the participants' data ranged from 7,560 to 8,760 hours, with an average of 8,716 hours per year (approximately 168 hours per week). In general, although individuals apparently reported high participation rates in noisy activities, the number of hours per year spent performing episodic noisy activities was by far much less than that spent performing routine (none-noisy) daily activities.
Fig. 3. Distribution of ANE values for the participants’
ANE values: Fig. 3 and Table 5 show the range of ANE values for all of the participants. If a participant reported minimal or no participation in episodic noise activities, routine exposures would form the basis for their ANE, resulting in the annual exposure of (the minimum possible
value). Accordingly, ANE values for the groups ranged from 64 to 88 , with the mean of 73 .
Fig. 3 shows the calculated for all of the participants, which ranged from 64 to 87 dB.
value). Accordingly, ANE values for the groups ranged from 64 to 88 , with the mean of 73 .
Fig. 3 shows the calculated for all of the participants, which ranged from 64 to 87 dB.
Table 5. The participants’ ANE by percentage and mean
| ANE (dB) | ||||
| Range | 10th percentile | 50th percentile | 90th percentile | Mean |
| 64-88 | 68 | 72 | 81 | 73 |
Determination of noise exposures of the "highest risk": Determining which value is of a high risk for depends on what standards are used to assess the risk. Based on the annual risk taken from standards, such as the NIOSH 1998 and EPA, sound level values of and were considered the highest risk values, respectively [16, 29]. Table
6 shows the number of the individuals in the present study, who met the highest NIHL risk criteria.
Since unprotected exposure to firearm noises is considered a hearing loss risk [14], without considering the use of hearing protection devices (HPDs) while using firearms, the participants who mentioned exposure to firearms have been listed in Table 6.
Table 6. Participants meeting the highest NIHL risk criteria
| Participants meeting criteria | Participants (n = 70) Number (percent) |
|
| Current study ( ) | 12 (17.14%) | |
| EPA criteria ( ) | 49 (70%) | |
| Firearm noise exposure | 9 (13%) | |
1-Minute Noise Screening method: The other goals of this research were to validate the first part of the NEQ and to estimate the participants’ NIHL scores. In fact, the first part was a set of screening questions that we could use to examine the participants who were at a high risk of NIHL [16]. To this end, we evaluated six potential screening questions (1 to 6) to assess their ability to predict self-reported noise exposure (ANE). Previous studies showed statistically positive results for this method [16]. In the present study, Cronbach's alpha and ICC coefficients for the screening method were 0.93 and 0.87, respectively. Among the questions about adverse hearing symptoms, we only found a significant relationship between questions 5 (TTS) and 6 (other hearing symptoms) with the individuals’ ANE; however, there was no correlation between question 4 (tinnitus) and ANE. Since questions 3 to 6 (questions about auditory symptoms) in the Johnson’ study were not able to correctly predict NIHL, he removed them from the final questionnaire [16]. Hence, to use the scoring system of the Johnson’ study, we evaluated the participants’ answers without considering the first three questions. The final screening score whose calculation method was described in the method section can be compared with the value obtained from questions 7 to 17. In this study, was used as the final criterion to determine the NIHL risk. Based on the exposure limits set in this study, values 79 were considered the highest risks. Given the scores obtained from the screening section, the scores in this section ranged from 0 to 12. In this study, we screened individuals at high NIHL risks by interpreting the final scores of the screening method. Regarding the screening method, scores ranging from 0 to 4 and score 5 or higher were considered low and high risks, respectively. Accordingly, 22 (about 31.5%) and 48 (68.5%) participants had scores ranging from 0 to 4 and 5 or higher, respectively.
Discussion
NEQ and ANE quantification: According to established standards, the permissible noise level for preventing NIHL or occupational hearing loss in working environments is 85 dB, or 90 dB in other standards. However, despite noise levels being under the permissible limit in many work environments, occupational hearing loss has been occurring to workers. Since occupational hearing loss is a cumulative process occurring over time, not being rooted in the workplace noise alone, many NIHLs must be considered and attributed to non-occupational noise outside the workplace. This magnifies harmful effects of noise in work environments. For instance, one study found that people listening to loud music through a headset had a significantly worsened hearing threshold, which increased the risk of hearing loss [30]. The NEQ is one of the most comprehensive questionnaires employed to assess occupational and non-occupational noise exposures over the past year among all individuals. Using the NEQ, we could determine which individuals were at the highest NIHL risk. In this study, for the first time in Iran, we provided the Persian version of the NEQ questionnaire using the backward-forward method. Next, we distributed the questionnaire among 70 employees of an oil company in Assaluyeh City, Bushehr Province. In addition, we used Cronbach's alpha and ICC methods to evaluate reliability. In examining the history of occupational and non-occupational noise exposure, this questionnaire has a major advantage. Accordingly, the people were not only asked to report their participation in noisy activities, but they were also asked to quantify the amount of the time spent in these activities and the amount of the time spent using hearing protection devices (HPDs) when participating in such activities. In other words, using the NEQ, the expert could quantify the individual annual noise exposure (ANE) dose for occupational and non-occupational noises in less than 10 minutes to diagnose NIHL. In general, the concurrent increasing of the sound level and the duration of each activity increased the participants’ NIHL risk. In this study, Kappa and Spearman's coefficients were calculated at 0.639 (a minimum of 0.340 and a maximum of 1) and 0.80 (a minimum of 0.514 and a maximum of 1), respectively, indicating a good agreement and a high correlation between the employees' answers [31]. Besides, concerning questionnaire validation, Cronbach's alpha and ICC coefficients were calculated at 0.918 and 0.856, respectively. In the studies of Susan and Johnson, validity of this method was established [16, 22]. In the study of Han et al, reliability of the questionnaire using the Cronbach's alpha method was calculated at 0.799; in addition, the ICC method showed that all questions were within an acceptable range [24]. According to Fig. 2, listening to music through earphones and a device speaker had the highest participation rates of 91.4 and 85.7%, respectively. Based on the findings of this investigation, listening to music through earphones or headsets had the highest participation rate of 91.4%. This indicates that an activity of a high participation frequency (an average of 160 hours/year) but at a low sound level (76 dB), general recreational activities, and noisy work activities had the least participation frequency (the average of both being 65 hours). However, listening to music through earphones or headsets accounted for only 1.79% dose in calculating a participant's overall ANE. In the studies of Johnson, Susan, and Han, the item of listening to music via earphones or headsets had the highest participation rate [16, 22, 24]. On the other hand, using "aircraft" had the lowest participation rate with 2.8% (an average of 5.30 hours/year), but the use of "aircraft" had a high noise level of 91 . Accordingly, exposure to aircraft noise only contributed 1.88% dose to an individual’s overall ANE. In the study of Han, the use of motorized vehicles had the lowest participation rate [24]. The data obtained from this study suggested that the participants had performed activities of high sound levels over the past year. In this study, the activity of the use of "motorized vehicles" had the highest dose (36.62%) which contributed to the total ANE. The mean in this study was 73 dB for all participants (Table 5), being consistent with in many similar studies [14, 16, 22, 32]. According to the findings of the present study, when we used standards and , 17.14 and 70% of the participants were at a high risk of developing NIHL, respectively. Besides, when we used the 79 dB criterion, fewer people were at the high risk of NIHL than EPA. In Johnson's study, these values were 32 and 75%, respectively [16]. In the study of SA Hlousek et al, conducted on people using the NEQ questionnaire, it was found that 71.2 and 89% of the participants were at the highest risks of NIHL, according to the NIOSH and EPA standards, respectively [33]. As already mentioned, one of the major purposes of the NEQ is to estimate an individual’s one-year history of total noise exposure and their NIHL risk. However, there are some disadvantages, apart from advantages, in using this method. Among the disadvantages of the NEQ, one can refer to its high dependence on participants’ ability to recall noisy activities they performed in the past year to compute their ANE and NIHL. Besides, it relies on typical sound levels reported in other studies, with this producing an error as sound pressure levels could be different depending on workplace features. Additionally, it considers only the last 12-month activities to assess annual noise exposure. Furthermore, it only identifies people who are at the risk of NIHL, yet it cannot identify people who have hidden hearing loss (HHL); moreover, it does not consider the relationship between demographic factors and NIHL [16, 24]. Despite the mentioned limitations, the method used in this study had been validated in other studies; in fact, this method considers episodic noise activities and routine/daily noise activities together [14, 16, 35]. Another advantage of this questionnaire was that due to the COVID-19 pandemic, it was difficult to obtain a permit to enter the workplace, so we used the questionnaire. However, upon using this questionnaire and reference sound pressure levels mentioned in the valid studies, we were able to accurately evaluate the participants’ non-occupational noise exposure without measuring the sound pressure level.
This questionnaire had a question about impulse-noise exposure (question 12), which was related to the use of firearms, yet it was not included in the final calculation of ANE. However, firearms have a very high sound level that is very dangerous to the hearing system and significantly increases NIHL; thus, people with such exposure must be considered in terms of NIHL [16, 22]. Although we considered neither HPDs nor gunfire noise exposure to calculate ANE, these two specific items in the NEQ provided significant information to the audiologist and other professionals on the NIHL risk. In this study, 13% of the participants reported the experience of gunfire noise exposure, but only 11% of them utilized HPDs while using firearms. Several other studies reported the same results about not using HPDs while using firearms [16, 22]. Based on the findings of the present study for questions 7, 8, 9, 10, 12, 13, 16, and 17, a total of 26, 15, 8.6, 12.9, 11, 1.4, 72, and 69% used HPDs, respectively; however, regarding question 11, nobody used HPDs. Findings of the use of HPDs showed that the participants often used HPDs when they were exposed to occupational noise. As a reason, the use of HPDs in the workplace is compulsory. Besides, individuals are relatively aware of occupational noise dangers, so they require themselves to use HPDs. However, as they are not aware of the dangers of non-occupational exposure, they will not use HPDs if they do not have to. By assessing the participants' responses to how often they use HPDs for different episodic noise activities, hearing professionals could more appropriately give counsel on the need for adding, modifying, or continuing HPD use [16].
Screening individuals at the high risk of NIHL: Validating the 1-Minute Noise Screening method and predicting the NIHL score of the participants using that method were among the goals of this research. According to Johnson’s study, out of six questions, only the first three ones gained the required score and were able to properly identify high-risk noise exposure. However, the other three questions about hearing symptoms were eliminated due to noise exposure. This was because, firstly, they were unable to correctly predict the NIHL score, and secondly, this was because NIHL is one of the leading causes of inner ear damage and is often associated with hearing and ear symptoms [16]. The three remaining questions were about the use of firearms (question 1), noisy jobs (question 2), and other loud (recreational) noises (question 3). However, we evaluated the first three questions of the screening method in NIHL assessment. In fact, its validation using the mentioned methods as well as its kappa and Spearman’s coefficients showed desirable results. The results for Cronbach's alpha and ICC coefficients for the first six questions were 0.93 and 0.87, respectively. In addition, the kappa and Spearman's coefficients were calculated at 0.690 and 0.793, respectively. However, to use the 1-Minute Noise Screening method for the participants, we had to use the criteria mentioned in the Johnson’s study; thus, we used only the first three questions for participant assessment. The three questions (1, 2, 3) included in the main final questionnaire showed a high degree of accuracy ( ) in the study of Johnson et al [16]. Temporary threshold shift (TTS) and tinnitus (questions 4 and 5) were reported more frequently in NIHL studies [16, 36]. On the other hand, earache or a sense of fullness in the ears (questions 6) were more or less reported in studies as a possible symptom of noise exposure [16, 37]. In this study, for the screening method, a score between 0 and 4 and score 5 or higher were considered low and high risks, respectively. In addition, 22 (about 31.5%) and 48 participants (68.5%) had a score of 0 to 4 and 5 or higher, respectively. As already mentioned, according to the NIOSH and EPA standards, 17.14 and 70% of the people in this study were at the high risk of NIHL, respectively. Based on the results obtained from the screening method, 68.5% of the people were at a high risk, indicating that this method worked well in identifying people at a high risk of NIHL.
Individuals were not easily accessible in this study, having been one of its limitations. In addition, the low enthusiasm of the participants for participating in the study and COVID-19 constraints were the other limitations. Accordingly, it is suggested that similar methods and questionnaires be used in future studies with different groups to better understand strengths and weaknesses of this method.
Conclusion
The results of the present study showed that the NEQ helped us calculate annual non-occupational noise exposure levels leading to NIHL. In addition, using that questionnaire, we could estimate the proper time for providing the participants with HPDs to avoid NIHL. Another achievement of the present study was that in the case of the lack of time, the 1-Minute Noise Screen could be used by professionals to identify people at a high risk of NIHL in the workplace. However, it must be mentioned that this method has probably lower accuracy than the extended version of the NEQ. In addition to occupational health
professionals, hearing healthcare professionals as well as audiologists can use this tool to address the need for hearing protection programs for people at a high risk of NIHL.
Acknowledgement
The authors of this study would like to extend their gratitude to Mr. Mohammad Heidar Rafiei, the senior safety engineer at the oil company in Assaluyeh, who kindly and patiently assisted us with distributing and collecting the questionnaires, as well as briefing the Assaluyeh staff on the goals and stages of this study.
Conflict of interest: None declared.
References
1. Taban E, Soltani P, Berardi U, Putra A, Mousavi SM, Faridan M, et al. Measurement, modeling, and optimization of sound absorption performance of Kenaf fibers for building applications. Build Environ. 2020;180:107087. [DOI]
2. Sheikhmozafari MJ, Mohammad Alizadeh P, Ahmadi O, Mazloomi B. Assessment of Noise Effect on Employee Comfort in an Open-Plan Office: Validation of an Assessment Questionnaire. J Occup Health Epidemiol. 2021;10(3):193-203. [DOI]
3. Vosoughi S, Alimohammadi I, Hosseini AF, Sedghi Noushabadi Zh. Designing a Questionnaire to Investigate the Knowledge, Attitude, and Practice (KAP) of Printing Industry Workers Regarding Hearing Protection and Determining Its Validity and Reliability. J Occup Hyg Eng. 2019;6(1):43-51. [DOI]
4. Lin YT, Chen TW, Chang YC, Chen ML, Hwang BF. Relationship between time-varying exposure to occupational noise and incident hypertension: A prospective cohort study. Int J Hyg Environ Health. 2020;226:113487. [DOI] [PMID]
5. Ileperuma D, Arachchige IR. Hearing Status and Noise Exposure Levels of Workers at a Laundry Plant in Sri Lanka. Audiol Speech Res. 2022;18(2):95-101. [DOI]
6. Stokholm ZA, Erlandsen M, Schlünssen V, Basinas I, Bonde JP, Peters S, et al. A quantitative general population job exposure matrix for occupational noise exposure. Ann Work Expo Health. 2020;64(6):604-13. [DOI] [PMID]
7. Le TN, Straatman LV, Lea J, Westerberg B. Current insights in noise-induced hearing loss: a literature review of the underlying mechanism, pathophysiology, asymmetry, and management options. J Otolaryngol Head Neck Surg. 2017;46(1):41. [DOI] [PMID] [PMCID]
8. Basheer R, Bhargavi PG, Prakash HP. Knowledge, attitude, and practice of printing press workers towards noise-induced hearing loss. Noise Health. 2019;21(99):62-8. [DOI] [PMID] [PMCID]
9. Golmohammadi R, Khaefi N, AliabadiM. Assessment occupational noise and control plan presentation in Town Board Stations. J Sabzevar Uni Med Sci. 2019;26(3):319-327. [Article]
10. Miri SR, Zamani AR, Nasri A, Hadizadeh Goki H. Changes in the hearing threshold of workers in a steel industry: 5-year follow-up. Occup Med. 2020;12(3):35-43. [DOI]
11. Tak S, Davis RR, Calvert GM. Exposure to hazardous workplace noise and use of hearing protection devices among US workers—NHANES, 1999–2004. Am J Ind Med. 2009;52(5):358-71. [DOI] [PMID]
12. Thepaksorn P, Koizumi A, Harada K, Siriwong W, Neitzel RL. Occupational noise exposure and hearing defects among sawmill workers in the south of Thailand. Int J Occup Saf Ergon. 2019;25(3):458-66. [DOI] [PMID]
13. Sajin S, Chin CS, Neo J. Acoustics vs. psychoacoustics: An objective and subjective analysis of classroom acoustics in Singapore. Noise Control Eng J. 2019;67(2):80-97. [DOI]
14. Neitzel R, Seixas N, Goldman B, Daniell W. Contributions of non-occupational activities to total noise exposure of construction workers. Ann Occup Hyg. 2004;48(5):463-73. [DOI] [PMID]
15. Neitzel R.L, Svensson EB, Sayler SK, Ann-Christin J. A comparison of occupational and nonoccupational noise exposures in Sweden. Noise Health. 2014;16(72):270-8. [DOI] [PMID]
16. Johnson TA, Cooper S, Stamper GC, Chertoff M. Noise exposure questionnaire: A tool for quantifying annual noise exposure. J Am Acad Audiol. 2017;28(1):14-35. [DOI] [PMID] [PMCID]
17. Bramhall N, Beach EF, Epp B, Le Prell CG, Lopez-Poveda EA, Plack CJ, et al. The search for noise-induced cochlear synaptopathy in humans: Mission impossible? Hear Res. 2019;377:88-103. [DOI] [PMID]
18. Ridley CL, Kopun JG, Neely ST, Gorga MP, Rasetshwane DM. Using thresholds in noise to identify hidden hearing loss in humans. Ear Hear. 2018;39(5):829-44. [DOI] [PMID] [PMCID]
19. Sheikhmozafari MJ, Mohammad Alizade P, Ahmadi O. Validation of the Persian version of the Workplace Physical-Ergonomic Conditions Evaluation (PECE) Questionnaire. Int J Musculoskeletal Pain Prev. 2021;6(3):554-61. [DOI]
20. Beaton DE, Bombardier C, Guillemin F, Ferraz MB. Guidelines for the process of cross-cultural adaptation of self-report measures. Spine (Phila Pa 1976). 2000;25(24):3186-91. [DOI] [PMID]
21. Torre P 3rd, Reed MB. Can self-reported personal audio system volume predict actual listening levels in young adults? J Am Acad Audiol. 2019;30(2):153-61. [DOI] [PMID]
22. Megerson SC. Development of a screening tool for identifying young people at risk for noise-induced hearing loss [PhD Thesis]. Lawrence, Kansas, United States: University of Kansas; 2010. [Thesis]
23. Athirah B, Nurul Shahida MS. Occupational Noise Exposure Among Airport Workers in Malaysia: An Ergonomic Investigation. In: J Phys: Conference Series, Vol 1262. Proceedings of the 1st Colloquium on Noise, Vibration and Comfort ; 2019 Mar 7; Selangor, Malaysia. Bristol, United Kingdom: IOP Publishing; 2019. P.012010. [DOI]
24. Han K, Wang Q, Yang L, Xu S, Li C, Lin J, et al. Development and initial validation of the Chinese Version of the Noise Exposure Questionnaire (C-NEQ). BMC Public Health. 2022;22(1):207. [DOI] [PMID] [PMCID]
25. Stamper GC, Johnson TA. Auditory function in normal-hearing, noise-exposed human ears. Ear Hear. 2015;36(2):172-84. [DOI] [PMID] [PMCID]
26. Taylor L. Utilization of a clinical testing battery to help identify suspected hidden hearing loss (HHL) in humans [PhD Thesis]. Towson, Maryland, United States: Towson University; 2018. [Thesis]
27. Lee WL, Chinna K, Lim Abdullah K, Zainal Abidin I. The forward‐backward and dual‐panel translation methods are comparable in producing semantic equivalent versions of a heart quality of life questionnaire. Int J Nurs Pract. 2019;25(1):e12715. [DOI] [PMID]
28. Tsang S, Royse CF, Terkawi AS. Guidelines for developing, translating, and validating a questionnaire in perioperative and pain medicine. Saudi J Anaesth. 2017;11(Suppl 1):S80-9. [DOI] [PMID] [PMCID]
29. 29. The National Institute for Occupational Safety and Health. Criteria for a Recommended Standard: Occupational Noise Exposure revised criteria 1998. Cincinnati, OH: U.S. Department of Health and Human Services, Public Health Service, Centers for Disease Control and Prevention, National Institute for Occupational Safety and Health, DHHS (NIOSH) Publication; 1998 Jun. 132p. Report No.:98-126. [Report]
30. Engdahl B, Aarhus L. Personal music players and hearing loss: the HUNT cohort study. Trends Hear. 2021;25:23312165211015881. [DOI] [PMID] [PMCID]
31. Mohajan HK. Two criteria for good measurements in research: Validity and reliability. Ann Spiru Haret Univ 2017;17(4):59-82. [DOI]
32. Go NS. Noise Exposure, Self-Reported Speech-in-Noise Perception, and the Auditory Brainstem Response in Normal-Hearing Human Ears [PhD Thesis]. Lawrence, Kansas, United States: University of Kansas; 2018. [Thesis]
33. Hlousek SA, Hoffman K, Bailey C, Washnik N. Noise Exposure Effects on Physiological and Perceptual Measures of the Auditory System. J Hear Sci. 2022;12(1).
34. 34. E Hanson. Identifying and Quantifying Hidden Hearing Loss [Ph.D Thesis]. Iowa City, Iowa, United States: University of Iowa; 2018.
35. Reeb-Whitaker CK, Seixas NS, Sheppard L, Neitzel R. Accuracy of task recall for epidemiological exposure assessment to construction noise. Occup Environ Med. 2004;61(2):135-42. [DOI] [PMID] [PMCID]
Send email to the article author
| Rights and permissions | |
 |
This work is licensed under a Creative Commons Attribution 4.0 International License. |
