Journal of Occupational
Health and Epidemiology

Rafsanjan university Of medical sciences
Volume 15, Issue 1 (Winter 2026)
J Occup Health Epidemiol 2026, 15(1): 13-22 |
Back to browse issues page




Download citation:
BibTeX | RIS | EndNote | Medlars | ProCite | Reference Manager | RefWorks
Send citation to:


BibTeX | RIS | EndNote | Medlars | ProCite | Reference Manager | RefWorks
Send citation to:
Hashim S A, Alkhawaldeh J, Ibadi A, Barakatun-Nisak M Y, Alidrisi H, Mansour A A et al . Associated Factors and Knowledge of Type 2 Diabetes among Non Medical University Students in Southern Iraq. , J Occup Health Epidemiol. 2026; 15 (1) :13-22
URL: http://johe.rums.ac.ir/article-1-1099-en.html
URL: http://johe.rums.ac.ir/article-1-1099-en.html
Related article in
Google Scholar
Google Scholar
Similar articles
Saman A Hashim *1 

 , Ja’far Alkhawaldeh2 , Atheer Ibadi3 , Mohd Y Barakatun-Nisak4 , Haider Alidrisi5 , Abbas A Mansour6 , Ibrahim Zaboon7
1- Assistant Prof., Dept. of Community Health, Technical Medical Institute in Basrah, Southern Technical University, Basrah, Iraq. , saman.hashim@stu.edu.iq
2- Associate Prof., Faculty of Nursing, Isra University, Amman, Jordan.
3- Professor, Dept. of Pharmacy, Kufa Institute, Al-Furat Al-Awsat Technical University, Iraq.
4- Assistant Prof., Dept. of Dietetics, Faculty of Medicine and Health Sciences, University Putra Malaysia, Serdang, Malaysia. & Assistant Prof., Institute for Social Sciences Studies, University Putra Malaysia, Serdang, Malaysia.
5- Assistant Prof., Faiha Specialized Diabetes, Endocrine, and Metabolism Center (FDEMC), University of Basrah, Basrah, Iraq
6- Professor, Faiha Specialized Diabetes, Endocrine, and Metabolism Center (FDEMC), University of Basrah, Basrah, Iraq.
7- Medical Doctor, Faiha Specialized Diabetes, Endocrine, and Metabolism Center (FDEMC), Basrah Health Directorate, Basrah, Iraq.
2- Associate Prof., Faculty of Nursing, Isra University, Amman, Jordan.
3- Professor, Dept. of Pharmacy, Kufa Institute, Al-Furat Al-Awsat Technical University, Iraq.
4- Assistant Prof., Dept. of Dietetics, Faculty of Medicine and Health Sciences, University Putra Malaysia, Serdang, Malaysia. & Assistant Prof., Institute for Social Sciences Studies, University Putra Malaysia, Serdang, Malaysia.
5- Assistant Prof., Faiha Specialized Diabetes, Endocrine, and Metabolism Center (FDEMC), University of Basrah, Basrah, Iraq
6- Professor, Faiha Specialized Diabetes, Endocrine, and Metabolism Center (FDEMC), University of Basrah, Basrah, Iraq.
7- Medical Doctor, Faiha Specialized Diabetes, Endocrine, and Metabolism Center (FDEMC), Basrah Health Directorate, Basrah, Iraq.
Article history

Received: 2025/08/12
Accepted: 2025/11/20
ePublished: 2026/03/30
Accepted: 2025/11/20
ePublished: 2026/03/30
Subject:
Epidemiology
Keywords: Type 2 Diabetes [MeSH], Knowledge [MeSH], Attitudes [MeSH], Practices [MeSH], Students [MeSH], University [MeSH], Iraq [MeSH]
Full-Text [PDF 548 kb]
(404 Downloads)
| Abstract (HTML) (1263 Views)
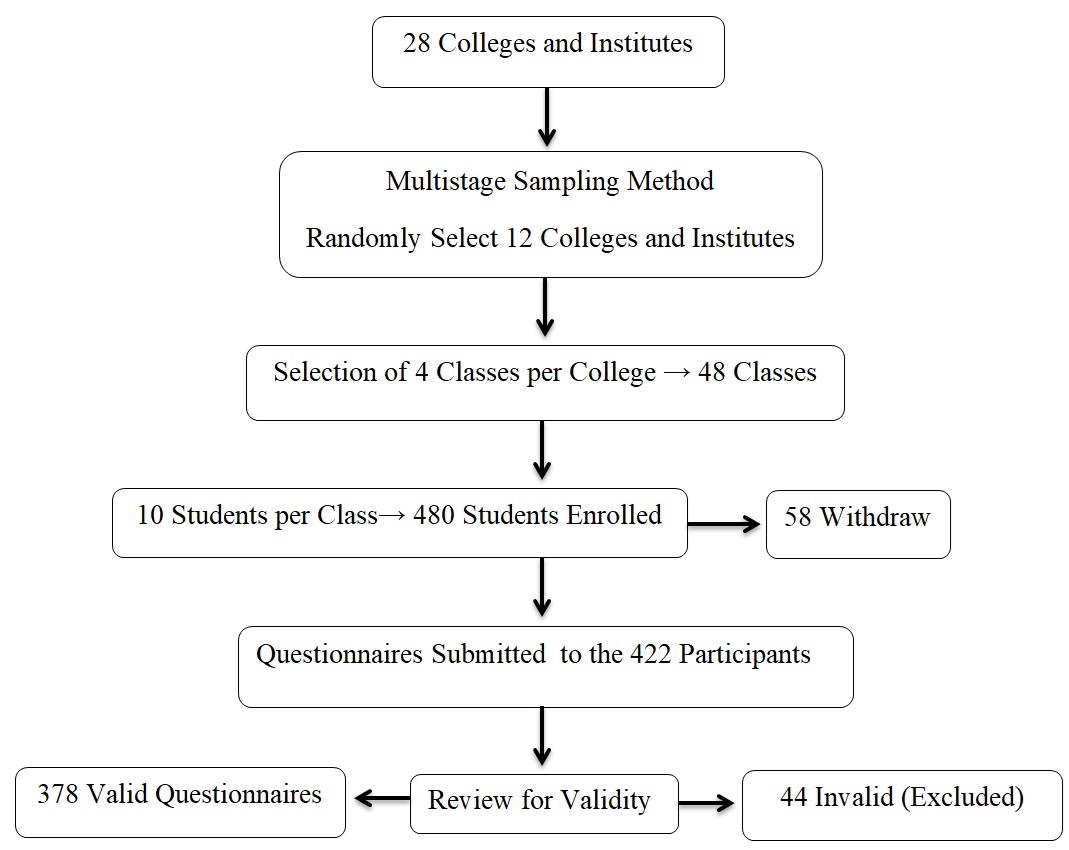
Fig. 1. Screening and Recruitment of the Study Participants.
Table 1. Sociodemographic characteristics and some factors of study participants (n=378).
Table 2. The relationship between the scores of KAPs and some participants' parameters.
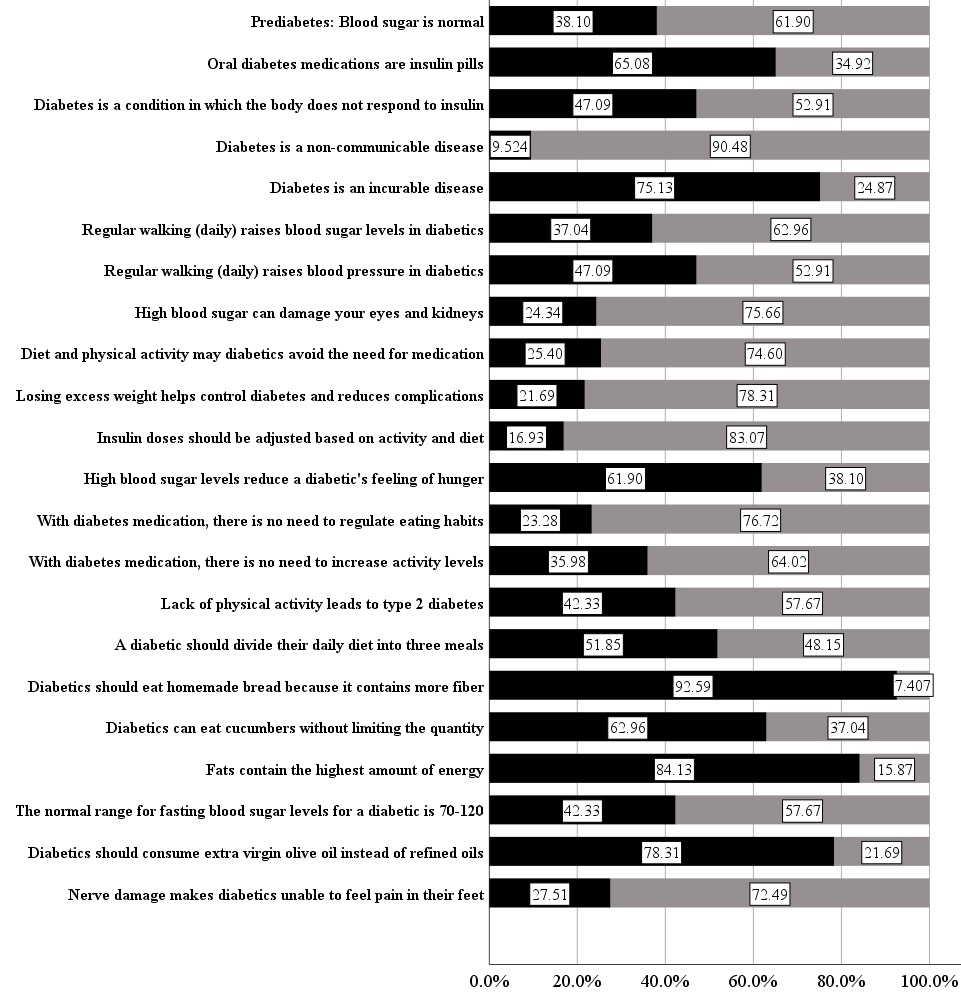
Fig. 2. Study participants' responses to knowledge questions.
Table 3. Study participants' responses to attitudes and practices (n = 378)
Table 4. Associated factors of knowledge, attitudes, and practices among university students (n = 378)
Full-Text: (9 Views)
Introduction
Type 2 diabetes (T2D) represents one of the most pressing global public health challenges, with its prevalence growing disproportionately in low- and middle-income countries (LMICs), including Iraq [1]. The growing burden of T2D is attributed to lifestyle changes, poor dietary habits, as well as low knowledge of risk factors [2]. While healthcare professionals are well-informed about T2D prevention and management, non-medical populations, especially university students, often lack sufficient knowledge about the disease [3]. In Iraq, where urbanization and shifting dietary patterns may contribute to T2D risk [4, 5], comprehending the factors associated with T2D knowledge among non-medical university students is critical for developing targeted interventions [6].
In spite of the rising prevalence of T2D in Iraq, only one education tool was developed in Basrah, Iraq, to promote diabetes knowledge [7], but it was not inadequate as an educational program in this region. Indeed, there remains a significant knowledge gap, as well as risk perception and practices about the disease, particularly among young adults outside the healthcare sector [8]. University students, who represent a key demographic for preventive health strategies, may lack essential knowledge about T2D risk factors, symptoms, and complications [9]. This knowledge gap could result in delayed diagnosis, poor lifestyle choices, and higher susceptibility to the disease [10, 11]. Nevertheless, limited research has explored the factors associated with T2D knowledge as well as the extent of this knowledge gap among university students, particularly in Southern regions of Iraq, making this study critical for public health planning. A study in Saudi Arabia found that only 46.0% of university students could correctly identify T2D symptoms and its pathophysiology [3]. Similar trends were observed in Algeria [12] and Jordan [13], where non-medical students revealed poor knowledge of preventive measures.
Despite awareness of its significance, diabetes education is not standard in Iraqi schools, thus creating a significant knowledge gap [14]. This study explores factors such as family history and sources of health information to inform policymakers [15]. The findings will help develop targeted educational programs for university students to ameliorate prevention, lower future T2D cases, and curb the growing crisis in Iraq. Thus, this study aims to appraise diabetes-related knowledge, attitudes, and practices (KAP) as well as explore the associated factors among non-medical university students in southern Iraq.
Materials and Methods
This study applies an analytic cross-sectional study design to ascertain the knowledge, attitudes, and practices (KAPs) related to type 2 diabetes (T2D) among non-medical university students in Basrah, Iraq, from October 2024 to April 2025.
Given the multiplicity of faculties and departments, a multistage sampling method was utilized. The multistage sampling technique was employed. Initially, 12 out of 28 colleges and institutes at the University of Basrah and Southern Technical University were randomly selected. Next, within each college, four classes per semester were randomly chosen. Ultimately, approximately 10 students were systematically selected from each class list to participate. The study targeted 378 different non-medical university students from the University of Basrah and Southern Technical University, including engineering (35%), arts (11%), sciences (34%), and other non-medical disciplines (20%), providing education for both diploma and bachelor degrees in Southern Iraq. These percentages were based on sampling weights. The only inclusion criterion was non-medical undergraduates aged 18–30 years old. The exclusion criteria included medical or healthcare students, those who did not wish to participate in the study, and those diagnosed with T2D based on the American Diabetes Association guidelines [16].
A structured questionnaire with closed-ended questions was valid among Arab people in a neighboring country, Jordan; so, this questionnaire was adopted [15] and then modified prior to its use. Since it underwent modification, the questionnaire was also validated through expert review and a pilot study (n=30) to ascertain clarity and reliability (Cronbach's alpha = 0.87). The questionnaire contained four main sections: Socio-demographic and Medical Information, which collected data on age, sex, academic level, BMI (categorized by WHO standards), family history of T2D, and sources of health information. It also included questions about personal health behaviors pertained to diabetes. Knowledge Assessment: A 22-item test (multiple-choice and yes/no) on various aspects of T2D. Correct answers were scored to generate a total percentage, with higher scores reflecting greater knowledge. Attitude Assessment: A 3-item threat perception scale using a 4-point Likert scale. Responses were summed and converted to percentages to measure participants' perceived risk and the seriousness of T2D. Practice Assessment: A 7-item scale using a 4-point Likert scale to assess health behaviors. One item was reverse-scored. Total scores were converted to a percentage. The participants also identified their single most-used source of T2D information.
The knowledge section was employed to appraise understanding of T2D causes, symptoms, complications, and management. The scoring method assigns 1 point for each correct answer and 0 for each incorrect/don't know answer. The total knowledge score was calculated by summing the points obtained for each question, with one point assigned to each correct answer. Categorized knowledge levels are poor (≤50% correct), moderate (51–75%), and good (>75%). The attitudes section was utilized to gauge perceptions, beliefs, and emotional responses toward T2D. The scoring method applies a Likert scale (e.g., 1–5 points per item): Strongly disagree (1) to strongly agree (5) for positive statements and reverse-score negative statements (e.g., T2D is not serious). Thus, the categorized attitudes are negative (lower tertile), neutral (middle tertile), and positive (upper tertile). Further, the practices section was utilized to evaluate behaviors related to T2D prevention/management (e.g., diet, exercise, medication adherence). The scoring method is frequency-based scoring: Never (0) / Sometimes (1) / Often (2) / Always (3). Higher scores would reflect better practices. Therefore, the categorized practices are Poor (≤50% of max score), Fair (51–75%), and Good (>75%).
The participants were given up to 15 minutes to complete the questionnaire. The researchers collected data in a quiet, comfortable classroom to ensure accurate measurement of their actual knowledge, attitudes (beliefs), and practices. In order to address potential sources of bias, students were asked to avoid access to their books, notebooks, or the Internet, as well as to avoid discussing the questions with their classmates. Once the allotted time had elapsed, the questionnaires were collected and stored in a secure cabinet until the end of the data collection period. Data were collected over 7 months, ensuring a diverse representation of students across faculties.
Data were analyzed using SPSS Statistics (V.25.0, IBM, SPSS, Chicago, Illinois, USA) via the following statistical approaches. Descriptive statistics include frequencies, percentages, mean, and standard deviation for demographic and KAP variables. Inferential statistics also included the Chi-square or Fisher's exact test to appraise associations between demographic factors and KAP levels. A one-way between-groups analysis of variance (ANOVA) was employed to inspect the impact of variables with more than two groups. A post-hoc analysis with Hochberg's GT2 was employed to identify which group was more effective when group sizes were extremely unequal. Pearson's Correlation measures linear relationships between continuous variables (e.g., KAPs score). Ultimately, stepwise multiple linear regression models (p in < 0.05, p out > 0.20) were fitted to examine the factors influencing the level of diabetes-related KAP. Missing data were manually handled for each variable. A p-value < 0.05 (two-tailed) was considered significant.
Type 2 diabetes (T2D) represents one of the most pressing global public health challenges, with its prevalence growing disproportionately in low- and middle-income countries (LMICs), including Iraq [1]. The growing burden of T2D is attributed to lifestyle changes, poor dietary habits, as well as low knowledge of risk factors [2]. While healthcare professionals are well-informed about T2D prevention and management, non-medical populations, especially university students, often lack sufficient knowledge about the disease [3]. In Iraq, where urbanization and shifting dietary patterns may contribute to T2D risk [4, 5], comprehending the factors associated with T2D knowledge among non-medical university students is critical for developing targeted interventions [6].
In spite of the rising prevalence of T2D in Iraq, only one education tool was developed in Basrah, Iraq, to promote diabetes knowledge [7], but it was not inadequate as an educational program in this region. Indeed, there remains a significant knowledge gap, as well as risk perception and practices about the disease, particularly among young adults outside the healthcare sector [8]. University students, who represent a key demographic for preventive health strategies, may lack essential knowledge about T2D risk factors, symptoms, and complications [9]. This knowledge gap could result in delayed diagnosis, poor lifestyle choices, and higher susceptibility to the disease [10, 11]. Nevertheless, limited research has explored the factors associated with T2D knowledge as well as the extent of this knowledge gap among university students, particularly in Southern regions of Iraq, making this study critical for public health planning. A study in Saudi Arabia found that only 46.0% of university students could correctly identify T2D symptoms and its pathophysiology [3]. Similar trends were observed in Algeria [12] and Jordan [13], where non-medical students revealed poor knowledge of preventive measures.
Despite awareness of its significance, diabetes education is not standard in Iraqi schools, thus creating a significant knowledge gap [14]. This study explores factors such as family history and sources of health information to inform policymakers [15]. The findings will help develop targeted educational programs for university students to ameliorate prevention, lower future T2D cases, and curb the growing crisis in Iraq. Thus, this study aims to appraise diabetes-related knowledge, attitudes, and practices (KAP) as well as explore the associated factors among non-medical university students in southern Iraq.
Materials and Methods
This study applies an analytic cross-sectional study design to ascertain the knowledge, attitudes, and practices (KAPs) related to type 2 diabetes (T2D) among non-medical university students in Basrah, Iraq, from October 2024 to April 2025.
Given the multiplicity of faculties and departments, a multistage sampling method was utilized. The multistage sampling technique was employed. Initially, 12 out of 28 colleges and institutes at the University of Basrah and Southern Technical University were randomly selected. Next, within each college, four classes per semester were randomly chosen. Ultimately, approximately 10 students were systematically selected from each class list to participate. The study targeted 378 different non-medical university students from the University of Basrah and Southern Technical University, including engineering (35%), arts (11%), sciences (34%), and other non-medical disciplines (20%), providing education for both diploma and bachelor degrees in Southern Iraq. These percentages were based on sampling weights. The only inclusion criterion was non-medical undergraduates aged 18–30 years old. The exclusion criteria included medical or healthcare students, those who did not wish to participate in the study, and those diagnosed with T2D based on the American Diabetes Association guidelines [16].
A structured questionnaire with closed-ended questions was valid among Arab people in a neighboring country, Jordan; so, this questionnaire was adopted [15] and then modified prior to its use. Since it underwent modification, the questionnaire was also validated through expert review and a pilot study (n=30) to ascertain clarity and reliability (Cronbach's alpha = 0.87). The questionnaire contained four main sections: Socio-demographic and Medical Information, which collected data on age, sex, academic level, BMI (categorized by WHO standards), family history of T2D, and sources of health information. It also included questions about personal health behaviors pertained to diabetes. Knowledge Assessment: A 22-item test (multiple-choice and yes/no) on various aspects of T2D. Correct answers were scored to generate a total percentage, with higher scores reflecting greater knowledge. Attitude Assessment: A 3-item threat perception scale using a 4-point Likert scale. Responses were summed and converted to percentages to measure participants' perceived risk and the seriousness of T2D. Practice Assessment: A 7-item scale using a 4-point Likert scale to assess health behaviors. One item was reverse-scored. Total scores were converted to a percentage. The participants also identified their single most-used source of T2D information.
The knowledge section was employed to appraise understanding of T2D causes, symptoms, complications, and management. The scoring method assigns 1 point for each correct answer and 0 for each incorrect/don't know answer. The total knowledge score was calculated by summing the points obtained for each question, with one point assigned to each correct answer. Categorized knowledge levels are poor (≤50% correct), moderate (51–75%), and good (>75%). The attitudes section was utilized to gauge perceptions, beliefs, and emotional responses toward T2D. The scoring method applies a Likert scale (e.g., 1–5 points per item): Strongly disagree (1) to strongly agree (5) for positive statements and reverse-score negative statements (e.g., T2D is not serious). Thus, the categorized attitudes are negative (lower tertile), neutral (middle tertile), and positive (upper tertile). Further, the practices section was utilized to evaluate behaviors related to T2D prevention/management (e.g., diet, exercise, medication adherence). The scoring method is frequency-based scoring: Never (0) / Sometimes (1) / Often (2) / Always (3). Higher scores would reflect better practices. Therefore, the categorized practices are Poor (≤50% of max score), Fair (51–75%), and Good (>75%).
The participants were given up to 15 minutes to complete the questionnaire. The researchers collected data in a quiet, comfortable classroom to ensure accurate measurement of their actual knowledge, attitudes (beliefs), and practices. In order to address potential sources of bias, students were asked to avoid access to their books, notebooks, or the Internet, as well as to avoid discussing the questions with their classmates. Once the allotted time had elapsed, the questionnaires were collected and stored in a secure cabinet until the end of the data collection period. Data were collected over 7 months, ensuring a diverse representation of students across faculties.
Data were analyzed using SPSS Statistics (V.25.0, IBM, SPSS, Chicago, Illinois, USA) via the following statistical approaches. Descriptive statistics include frequencies, percentages, mean, and standard deviation for demographic and KAP variables. Inferential statistics also included the Chi-square or Fisher's exact test to appraise associations between demographic factors and KAP levels. A one-way between-groups analysis of variance (ANOVA) was employed to inspect the impact of variables with more than two groups. A post-hoc analysis with Hochberg's GT2 was employed to identify which group was more effective when group sizes were extremely unequal. Pearson's Correlation measures linear relationships between continuous variables (e.g., KAPs score). Ultimately, stepwise multiple linear regression models (p in < 0.05, p out > 0.20) were fitted to examine the factors influencing the level of diabetes-related KAP. Missing data were manually handled for each variable. A p-value < 0.05 (two-tailed) was considered significant.
Fig. 1. Screening and Recruitment of the Study Participants.
Results
In order to ensure an unbiased sample, the researchers applied a multistage sampling method. They started with 480 student participants but ended with 378 valid questionnaires after accounting for withdrawals as well as incomplete forms, leading to a 79% response rate. The final study group consisted of 378 participants, with a mean age of 24.7 years and a nearly equal gender distribution (50.8% male, 49.2% female).
The study found that the majority of participants were single undergraduate students, most with a normal or overweight BMI. Considering diabetes awareness, the participants demonstrated moderate knowledge and positive attitudes but suboptimal practices. Regarding the key findings, nearly half had a family history of type 2 diabetes (T2D), but very few had attended related courses. Less than half had ever checked their blood glucose, with the Internet being the most common source of T2D information (Table 1).
In order to ensure an unbiased sample, the researchers applied a multistage sampling method. They started with 480 student participants but ended with 378 valid questionnaires after accounting for withdrawals as well as incomplete forms, leading to a 79% response rate. The final study group consisted of 378 participants, with a mean age of 24.7 years and a nearly equal gender distribution (50.8% male, 49.2% female).
The study found that the majority of participants were single undergraduate students, most with a normal or overweight BMI. Considering diabetes awareness, the participants demonstrated moderate knowledge and positive attitudes but suboptimal practices. Regarding the key findings, nearly half had a family history of type 2 diabetes (T2D), but very few had attended related courses. Less than half had ever checked their blood glucose, with the Internet being the most common source of T2D information (Table 1).
Table 1. Sociodemographic characteristics and some factors of study participants (n=378).
| Variable | Category | Frequency (%) |
| Sex | Male | 192 (50.8) |
| Female | 186 (49.2) | |
| Age group (years) | ≤ 22 | 178 (47.1) |
| > 22 | 200 (52.9) | |
| Marital Status | Married | 92 (24.3) |
| Single | 286 (75.7) | |
| BMI Category | Underweight < 18.5 | 14 (3.7) |
| Normal (18.5–24.9) | 172 (45.5) | |
| Overweight (25–29.9) | 166 (43.9) | |
| Obese (≥30) | 26 (6.8) | |
| Academic year | 1st year | 84 (22.2) |
| 2nd year | 140 (37.0) | |
| 3rd year | 76 (20.1) | |
| 4th year | 78 (20.6) | |
| Attended courses on T2D | Yes | 84 (22.2) |
| No | 294 (77.8) | |
| Have you ever checked BG? | Yes | 172 (45.5) |
| No | 206 (54.5) | |
| Family history of diabetes | Yes | 170 (45.0) |
| No | 208 (55.0) | |
| Had experience in the care of T2D | Never | 152 (40.2) |
| Rarely | 62 (16.4) | |
| Some times | 108 (28.6) | |
| Always | 56 (14.8) | |
| Information sources about T2D | Internet | 158 (41.8) |
| TV | 20 (5.3) | |
| Friends | 26 (6.9) | |
| Medical staff | 44 (11.6) | |
| Reading | 22 (5.8) | |
| Family | 108 (28.6) |
Note: %: percent, T2D: Type 2 Diabetes Mellitus, BMI: Body Mass Index, TV: Television, BG: Blood Glucose.
In Table 2, the knowledge, attitudes, and practices (KAP) analysis of diabetes indicated several important correlations with demographic and health factors: Age) Participants aged 22 and older had significantly higher knowledge and practice scores than those aged 22 and younger. Sex) Males had significantly greater knowledge and practice scores than their female counterparts. Marital status) Married participants scored higher on both knowledge and practice than unmarried participants. With regards to the weight status, underweight participants had higher knowledge scores than those in the normal weight and overweight groups. The obese group had the highest practice scores, significantly outperforming the underweight and normal weight groups. Essentially, older, male, married, and underweight individuals indicated better knowledge, while older, male, married, and obese individuals reported better practices.
The research found that knowledge, attitudes, and practices (KAP) regarding T2D were affected by several factors: Academic Year) First-year students had the lowest knowledge scores, while fourth-year students had the most positive attitudes; Formal Education) Attending T2D courses or workshops led to significantly higher KAP scores across all three categories (knowledge, attitude, and practice). Asking medical staff as a source of information on T2D was associated with higher practice scores (M = 70.6, SD = 14.3) compared to internet sources (p = 0.003) (Table 2).
The research found that knowledge, attitudes, and practices (KAP) regarding T2D were affected by several factors: Academic Year) First-year students had the lowest knowledge scores, while fourth-year students had the most positive attitudes; Formal Education) Attending T2D courses or workshops led to significantly higher KAP scores across all three categories (knowledge, attitude, and practice). Asking medical staff as a source of information on T2D was associated with higher practice scores (M = 70.6, SD = 14.3) compared to internet sources (p = 0.003) (Table 2).
Table 2. The relationship between the scores of KAPs and some participants' parameters.
| Variable | Category | Knowledge score (M ±SD) |
P-Value | Attitude score (M ±SD) |
P-Value | Practice score (M ±SD) |
P-Value |
| KAPs | Toal Score | 54.1 ± 15.9 |
| 75.9 ± 12.9 | 66.8 ± 13.9 | ||||||
| Age group (years) a | ≤ 22 | 51.9 ± 15.8 | 0.014 | 75.5 ±12.9 | 0.491 | 64.3 ±14.7 | 0.001 |
| > 22 | 55.9 ±15.8 | 76.4 ± 12.7 | 68.9 ± 12.9 | ||||
| Sex a | Males | 56.4 ± 14.8 | 0.003 | 76.2 ± 12.9 | 0.74 | 70.1 ± 13.6 | 0.000 |
| Females | 51.6 ± 16.7 | 75.7 ± 12.8 | 63.3 ± 13.5 | ||||
| BMI (kg/m2) b | Underweight | 57.2 ± 16.9 | 0.0421 | 73.8 ±13.4 | 0.470 | 56.6 ±13.3 | 0 .007 2 |
| Normal weight | 53.2 ± 15.6 | 75.0 ±12.6 | 67.4 ±13.9 | ||||
| Overweight | 53.4 ± 15.9 | 77.1 ±12.4 | 66.1 ±13.9 | ||||
| Obesity | 62.2 ± 15.4 | 76.3 ±15.9 | 72.1 ±12.2 | ||||
| Marital status a | Married | 59.9 ± 14.9 | 0.000 | 75.0 ± 12.1 | 0.429 | 69.5 ± 13.1 | 0.031 |
| single | 52.2 ± 15.7 | 76.2 ± 13.0 | 65.9 ± 14.2 | ||||
| Academic year | 1st year | 51.2 ± 16.9 | 0.0393 | 77.9 ±12.9 | 0.0004 | 67.9 ±14.1 | 0.220 |
| 2nd year | 52.9 ± 15.4 | 73.2 ±13.9 | 67.4 ±13.4 | ||||
| 3rd year | 57.8 ± 15.2 | 74.6 ±11.0 | 63.8 ±13.6 | ||||
| 4th year | 55.6 ± 15.8 | 80.4 ±10.7 | 67.2 ±15.1 | ||||
| Attendance workshops on T2D a | Yes | 61.5 ±14.6 | 0.000 | 78.8 ±11.6 | 0.027 | 75.9 ±9.9 | 0.000 |
| No | 51.9 ±15.6 | 75.2 ±13.1 | 64.1 ± 13.9 | ||||
| Checking BG before a | Yes | 59.4 ±14.5 | 0.000 | 79.1 ±12.7 | 0.000 | 68.7 ±14.2 | 0.014 |
| No | 49.6 ±15.7 | 73.3 ±12.3 | 65.1 ±13.6 | ||||
| Family history of T2D a | Yes | 59.1 ± 14.6 | 0.000 | 77.3 ± 11.9 | 0.070 | 67.7 ± 13.9 | 0.250 |
| No | 49.9 ± 15.7 | 74.8 ± 13.5 | 66.0 ± 14.1 | ||||
| Had experience in the care of T2D b | Never | 51.1 ± 15.3 | 0.0175 | 73.8 ± 14.6 | 0.039 |
63.7 ± 13.5 | 0.0036 |
| Rarely | 54.5 ± 17.3 | 77.4 ± 10.1 | 67.3 ± 13.7 | ||||
| Some times | 55.8 ± 16.9 | 76.6 ± 11.0 | 69.5 ± 12.8 | ||||
| Always | 58.1 ± 12.7 | 78.9 ± 13.0 | 69.2 ± 16.2 | ||||
| Information sources b | Internet | 52.6 ± 15.5 | 0.075 | 73.7 ± 14.2 | 0.005 7 | 64.9 ± 13.5 | 0.177 |
| TV | 60.5 ± 11.2 | 74.2 ± 10.4 | 64.6 ± 18.9 | ||||
| Friends | 48.3 ± 16.9 | 76.3 ± 13.7 | 67.4 ± 9.9 | ||||
| Medical staff | 57.0 ± 14.4 | 77.4 ± 10.8 | 70.6 ± 14.3 | ||||
| Reading | 55.8 ± 16.6 | 71.9 ± 13.3 | 69.2 ± 12.1 | ||||
| Family | 54.8 ± 16.9 | 79.6 ± 10.6 |
|
a: independent sample t-test, b: one-way between-group ANOVA, T2D: Type 2 Diabetes, BMI: Body Mass Index, BG: Blood Glucose, TV: Television. The p-value is significant at the 0.05 level.
1: there is a -9.014 difference between the mean of the normal weight group and the mean of the obesity group (p = 0.042). Similarly, there is a -8.842 difference between the means of the overweight and obesity groups (p = 0.048).
2: there is a -10.747 difference between the mean of underweight group and the mean of the normal weight group (p = 0.032). Likewise, there is a -15.483 difference between the mean of the underweight group and the mean of the obesity group (p = 0.005).
3: there is a -6.585 difference between the mean of the first-year group and the mean of the third group (p = 0.051).
4: there is a 4.657 difference between the mean of the first-year group and the mean of the second-year group (p = 0.048). In the same vein, there is a difference of –5.844 between the means of the third- and fourth-year groups (p = 0.027). In contrast, there is a difference of –7.217 between the means of the second- and fourth-year groups (p = 0.000).
5: there is a -6.981 difference between the mean of the
never-care diabetes patient group and the mean of the always-care diabetes patient group (p = 0.029).
6: A significant difference (−5.859) was observed between students who had never cared for a diabetes patient and those who had sometimes cared for a diabetes patient (p = 0.005).
This study revealed significant gaps and misconceptions in public knowledge about T2D. Whereas most people understood it is non-communicable and that high blood sugar is harmful, critical misunderstandings were common, as follows: Believing T2D is curable (only 25% knew it was incurable); Thinking "prediabetes" means normal blood sugar (62% were wrong); Believing oral diabetes medications are "insulin pills" (65% were wrong); Assuming medication eliminates the need for diet and exercise. Further, nutrition knowledge was poor, with most not knowing that fats provide the most energy and misunderstanding dietary advice. Overall, the findings highlight a need for ameliorated public education on the nature, management, and dietary principles of T2D (Fig. 2).
2: there is a -10.747 difference between the mean of underweight group and the mean of the normal weight group (p = 0.032). Likewise, there is a -15.483 difference between the mean of the underweight group and the mean of the obesity group (p = 0.005).
3: there is a -6.585 difference between the mean of the first-year group and the mean of the third group (p = 0.051).
4: there is a 4.657 difference between the mean of the first-year group and the mean of the second-year group (p = 0.048). In the same vein, there is a difference of –5.844 between the means of the third- and fourth-year groups (p = 0.027). In contrast, there is a difference of –7.217 between the means of the second- and fourth-year groups (p = 0.000).
5: there is a -6.981 difference between the mean of the
never-care diabetes patient group and the mean of the always-care diabetes patient group (p = 0.029).
6: A significant difference (−5.859) was observed between students who had never cared for a diabetes patient and those who had sometimes cared for a diabetes patient (p = 0.005).
This study revealed significant gaps and misconceptions in public knowledge about T2D. Whereas most people understood it is non-communicable and that high blood sugar is harmful, critical misunderstandings were common, as follows: Believing T2D is curable (only 25% knew it was incurable); Thinking "prediabetes" means normal blood sugar (62% were wrong); Believing oral diabetes medications are "insulin pills" (65% were wrong); Assuming medication eliminates the need for diet and exercise. Further, nutrition knowledge was poor, with most not knowing that fats provide the most energy and misunderstanding dietary advice. Overall, the findings highlight a need for ameliorated public education on the nature, management, and dietary principles of T2D (Fig. 2).
Fig. 2. Study participants' responses to knowledge questions.
The data reveal a significant disconnect between risk perception and preventive behaviors considering T2D. A major proportion of participants underestimated the threat of T2D, with over 90% not regarding it as a significant health danger or a serious risk for their age group. Most participants (over 80%) rated their personal likelihood of developing T2D as low, middle, or nonexistent. Behaviors were mixed: While a majority reported exercising regularly (72.5%) and often considering lifestyle changes (68.6%), other areas indicated concerning trends. Substantial portions of participants reported poor adherence to weight management (39.1%), a low-glucose diet (44.2%), and seeking professional health advice (56.3%). Moreover, over half of the participants (51.3%) expressed no interest in diabetes-related news (Table 3).
Table 3. Study participants' responses to attitudes and practices (n = 378)
| Attitudes | Category | Frequency (%) |
| My assessment of T2D and its impact on health | Very dangerous | 6 (1.6) |
| Dangerous | 20 (5.3) | |
| Not dangerous | 162 (42.9) | |
| No effect | 190 (50.3) | |
| My assessment of the impact of T2D on people my age | Very dangerous | 8 (2.1) |
| Dangerous | 70 (18.5) | |
| Not dangerous | 178 (47.1) | |
| No effect | 122 (32.3) | |
| My assessment of my likelihood of developing T2D | High | 32 (8.5) |
| Middle | 136 (36.0) | |
| Low | 160 (42.3) | |
| Zero | 50 (13.2) | |
| Practices | Category | Frequency (%) |
| I control my weight to reduce my risk of developing T2D | Never | 72 (19.0) |
| Rarely | 76 (20.1) | |
| Most times | 160 (42.3) | |
| Always | 70 (18.5) | |
| I exercise to reduce my risk of developing T2D | Never | 36 (9.5) |
| Rarely | 68 (18.0) | |
| Most times | 160 (42.3) | |
| Always | 114 (30.2) | |
| I eat a balanced and varied diet that contains less glucose | Never | 54 (14.3) |
| Rarely | 113 (29.9) | |
| Most times | 147 (38.9) | |
| Always | 64 (16.9) | |
| I talk to a healthcare professional to get information about T2D | Never | 104 (27.5) |
| Rarely | 109 (28.8) | |
| Most times | 108 (28.6) | |
| Always | 57 (15.1) | |
| I rely on accurate health information to change my lifestyle regarding T2D | Never | 46 (12.2) |
| Rarely | 69 (18.3) | |
| Most times | 166 (43.9) | |
| Always | 97 (25.7) | |
| I am considering changing my lifestyle to reduce my risk of developing T2D | Never | 54 (14.3) |
| Rarely | 65 (17.2) | |
| Most times | 165 (43.7) | |
| Always | 94 (24.9) | |
| I follow news related to T2D. |
With great interest | 45 (11.9) |
| With interest | 93 (24.6) | |
| No interest | 194 (51.3) | |
| Avoid it most of the time | 46 (12.2) |
Note: %: percentage, T2D: type 2 diabetes
A multiple regression analysis identified several factors significantly linked to diabetes knowledge scores among university students. The overall model explained 24.5% of the variance in scores. Factors that increased knowledge scores included having a family history of diabetes, being married, being a third-year student, and male gender. The factors that reduced knowledge scores included: never having checked one's blood glucose, never having attended a T2D workshop or course, and relying on friends as a source of T2D information, for diabetes-related attitudes (the model explains 12.0% of the variance). More positive attitudes were significantly correlated with: having checked their own blood glucose; relying on family for T2D information. Second-year students had significantly lower attitude scores, whereas fourth-year students had higher scores. For T2D prevention practices (the model explains 22.2% of variance). Significantly better prevention practices were associated with having attended a related event (non-attendance had a large negative impact), male gender, being a first- or second-year student, and older age (a small but significant benefit). Underweight status was a significant predictor of poorer practices (Table 4).
Table 4. Associated factors of knowledge, attitudes, and practices among university students (n = 378)
| Model (Knowledge) | B (95% CI) |
β | R2 | Adjusted R2 | t | p-value |
| Presence of family history of T2D | 8.475 | 0.267 | 0.092 | 0.090 | 5.745 | 0.000 |
| Students have not checked their blood glucose | -7.158 | -0.225 | 0.166 | 0.161 | -4.641 | 0.000 |
| Married student | 4.950 | 0.133 | 0.194 | 0.188 | 2.835 | 0.005 |
| Students in the third academic year | 5.777 | 0.147 | 0.211 | 0.202 | 3.169 | 0.002 |
| Male gender | 4.202 | 0.133 | 0.226 | 0.216 | 2.887 | 0.004 |
| Students have not attended a workshop on T2D | -4.071 | -0.106 | 0.235 | 0.223 | -2.181 | 0.030 |
| Friends are a source of information about T2D | -6.201 | -0.100 | 0.245 | 0.230 | -2.156 | 0.032 |
| Model (Attitudes) | B (95% CI) |
β | R2 | Adjusted R2 | t | p-value |
| Students have checked their blood glucose before | 5.033 | 0.196 | 0.048 | 0.046 | 3.968 | 0.000 |
| Family is a source of information about T2D | 5.598 | 0.199 | 0.082 | 0.077 | 4.048 | 0.000 |
| Students in the second academic year | -3.328 | -0.126 | 0.110 | 0.102 | -2.367 | 0.018 |
| Students in the fourth academic year | 3.502 | 0.110 | 0.120 | 0.110 | 2.054 | 0.041 |
| Model (Practices) | B (95% CI) |
β | R2 | Adjusted R2 | t | p-value |
| Students have not attended a workshop on T2D | -12.596 | -0.372 | 0.111 | 0.109 | -7.764 | 0.000 |
| Male gender | 5.357 | 0.192 | 0.162 | 0.157 | 4.000 | 0.000 |
| Students in the first academic year | 8.179 | 0.245 | 0.177 | 0.170 | 4.375 | 0.000 |
| Students in the second academic year | 5.220 | 0.181 | 0.195 | 0.187 | 3.432 | 0.001 |
| Underweight status | -8.477 | -0.116 | 0.209 | 0.199 | -2.497 | 0.013 |
| Age of the student | 0.329 | 0.127 | 0.222 | 0.210 | 2.461 | 0.014 |
B = unstandardized Coefficients, CI = confidence interval, B =standardized Coefficients, R2 = the proportion of variance in the criterion, t = t-statistic, T2D = type 2 diabetes. Reference categories = 0. The p-value is significant at the 0.05 level.
Discussion
The moderate level of knowledge (54.1%) and prevalent misconceptions (e.g., only 24.9% recognized T2D as incurable) mirror the results found among Saudi students [3], where actual knowledge scores were similarly suboptimal at 46.0%. Both studies identified gaps in understanding T2D pathophysiology and medication, with 65.1% of Iraqi students wrongly believing oral medications are "insulin pills," a misconception also noted among Saudi nursing students [3]. These parallels suggest systemic issues in health education across the region, possibly owing to curricular limitations or inadequate emphasis on T2D mechanisms [13].
Nevertheless, these findings were lower than those reported in a study performed in Kuwait [17] and Palestine [18] among students, whose knowledge scores were 63.2% and 78.0%, respectively. The discrepancy in results between this study and previous ones could be attributed to several factors, including robust health education programs in secondary schools and different assessment questions that were easier and used more familiar terminology, which may have led to higher knowledge scores in the previous studies.
The study showed a positive attitude of 75.9%, although 42.9% underestimated the severity of T2D. This result is better than in neighboring countries such as Jordan (46.3%) [13], Jordan (52.5%) [15], and Palestine (60.6%) [18], possibly because of cultural perceptions or lack of targeted education as well as difference period between studies, but was lower compared with a Saudi study [19] (83.3%) mirroring the current research. Positive attitudes may not always align with knowledge, highlighting the need for interventions that bridge this gap. Practices were suboptimal in 66.8%. Similar findings were observed in a study undertaken in the United States of America [20], where physical inactivity and poor dietary habits were common, signaling low engagement in preventive practices. In the United Arab Emirates, knowledge was 70.0% [21]. Still, practices such as regular exercise were poor. All studies identified a gap between knowledge and practice, especially in physical activity and preventive measures like blood glucose monitoring. The current study's suboptimal practices accord with the findings from the United Arab Emirates and the United States of America, emphasizing the need for interventions that bridge this gap.
The current study and Yaaqoob (2023) in Iraq [6] noted that older students had higher knowledge scores, possibly owing to cumulative education and experience. Males in the current study showed higher knowledge and practice scores, contrary to Gazzaz (2020) [19] and Asmar (2024) [18], in which females scored higher. This discrepancy may reflect cultural differences in access to health education. A family history of T2D is consistently linked to better knowledge and practices. This finding agrees with Asmar (2024) [18] and Yaaqoob (2023) [6], highlighting the role of personal exposure. It was also correlated with negative attitudes, possibly due to heightened risk perception [15]. Attendance at T2D workshops or courses significantly boosted knowledge and practices, underscoring the need for targeted educational interventions [3]. However, its influence on attitudes was negligible, suggesting that attitudes may require more nuanced approaches, such as peer-led initiatives or experiential learning [20].
Notably, the academic year revealed mixed results. While higher years were associated with greater knowledge [3], this did not always translate into ameliorated attitudes or practices, suggesting gaps in curriculum integration [15]. Primary sources of
information on T2D were the Internet (41.8%), family (28.6%), and medical staff (11.6%). These findings are in line with a study conducted in Algeria [12] among Algerian university students. In that research, the Internet/social media (41.7%) and family/friends (25.4%) were the primary sources, with healthcare providers being less common (12.7%). The reliance on informal sources (the Internet, family) rather than healthcare providers is a common theme, suggesting a need for more authoritative as well as accessible health education channels. The study's strengths include a diverse sample and a comprehensive KAP assessment, as along with a multistage sampling method utilized to avoid bias. However, the cross-sectional design would limit causal inferences, and self-reported data may introduce bias. The reliance on internet-based information (41.8%) as a primary source of knowledge may raise concerns about information quality.
In summary, this study revealed a concerning landscape of suboptimal knowledge, prevalent misconceptions, and inadequate preventive practices regarding T2D among the student population, findings that are largely in accordance with several regional studies.
Conclusion
This study highlighted moderate diabetes-related knowledge, positive attitudes, and suboptimal practices among non-medical university students in southern Iraq, with significant gaps in understanding the pathophysiology, curability, and management of type 2 diabetes (T2D). Key factors linked to better diabetes-related KAP scores included older age, male gender, marital status, higher academic year, family history of T2D, attendance at diabetes-related workshops, and reliance on medical staff for information. These findings emphasize the need for targeted educational interventions to enhance diabetes awareness, especially regarding disease severity, prevention, and self-management practices. Strengthening health promotion initiatives such as university-based workshops as well as accessible medical guidance could elevate KAP levels and help curb the growing burden of T2D among young adults in Iraq and similar populations.
Acknowledgements
This work was partially supported by Southern Technical University under the Scientific Research Award (No. 9/7934, 10 September 2025).
Conflict of interest
None declared.
Funding
None
Ethical Considerations
This study complied with the Strengthening the Reporting of Observational Studies in Epidemiology (STROBE) guidelines for cross‑sectional studies [22]. Ethical approval was obtained from the Medical Ethics Committee and the Scientific Research Unit.
Code of Ethics
Ethical approval was obtained from the Institutional Review Board (IRB) of Southern Technical University (IRB‑STU 7/27/199, October 10, 2024).
Authors' Contributions
Saman A. Hashim: Conception and design, Data acquisition, Statistical analysis, Drafting of the manuscript, Obtaining funding, Administrative, technical, or material support, Supervision; Ja’far M. Alkhawaldeh: Conception and design, Drafting of the manuscript; Atheer K. Ibadi: Conception and design, Drafting of the manuscript; Mohd Y. Barakatun‑Nisak: Supervision; Haider A. Alidrisi: Supervision; Abbas A. Mansour: Critical revision of the manuscript for important intellectual content, Statistical analysis; Ibrahim A. Zaboon: Data analysis and interpretation. All authors contributed to writing—review and editing and approved the final manuscript.
The moderate level of knowledge (54.1%) and prevalent misconceptions (e.g., only 24.9% recognized T2D as incurable) mirror the results found among Saudi students [3], where actual knowledge scores were similarly suboptimal at 46.0%. Both studies identified gaps in understanding T2D pathophysiology and medication, with 65.1% of Iraqi students wrongly believing oral medications are "insulin pills," a misconception also noted among Saudi nursing students [3]. These parallels suggest systemic issues in health education across the region, possibly owing to curricular limitations or inadequate emphasis on T2D mechanisms [13].
Nevertheless, these findings were lower than those reported in a study performed in Kuwait [17] and Palestine [18] among students, whose knowledge scores were 63.2% and 78.0%, respectively. The discrepancy in results between this study and previous ones could be attributed to several factors, including robust health education programs in secondary schools and different assessment questions that were easier and used more familiar terminology, which may have led to higher knowledge scores in the previous studies.
The study showed a positive attitude of 75.9%, although 42.9% underestimated the severity of T2D. This result is better than in neighboring countries such as Jordan (46.3%) [13], Jordan (52.5%) [15], and Palestine (60.6%) [18], possibly because of cultural perceptions or lack of targeted education as well as difference period between studies, but was lower compared with a Saudi study [19] (83.3%) mirroring the current research. Positive attitudes may not always align with knowledge, highlighting the need for interventions that bridge this gap. Practices were suboptimal in 66.8%. Similar findings were observed in a study undertaken in the United States of America [20], where physical inactivity and poor dietary habits were common, signaling low engagement in preventive practices. In the United Arab Emirates, knowledge was 70.0% [21]. Still, practices such as regular exercise were poor. All studies identified a gap between knowledge and practice, especially in physical activity and preventive measures like blood glucose monitoring. The current study's suboptimal practices accord with the findings from the United Arab Emirates and the United States of America, emphasizing the need for interventions that bridge this gap.
The current study and Yaaqoob (2023) in Iraq [6] noted that older students had higher knowledge scores, possibly owing to cumulative education and experience. Males in the current study showed higher knowledge and practice scores, contrary to Gazzaz (2020) [19] and Asmar (2024) [18], in which females scored higher. This discrepancy may reflect cultural differences in access to health education. A family history of T2D is consistently linked to better knowledge and practices. This finding agrees with Asmar (2024) [18] and Yaaqoob (2023) [6], highlighting the role of personal exposure. It was also correlated with negative attitudes, possibly due to heightened risk perception [15]. Attendance at T2D workshops or courses significantly boosted knowledge and practices, underscoring the need for targeted educational interventions [3]. However, its influence on attitudes was negligible, suggesting that attitudes may require more nuanced approaches, such as peer-led initiatives or experiential learning [20].
Notably, the academic year revealed mixed results. While higher years were associated with greater knowledge [3], this did not always translate into ameliorated attitudes or practices, suggesting gaps in curriculum integration [15]. Primary sources of
information on T2D were the Internet (41.8%), family (28.6%), and medical staff (11.6%). These findings are in line with a study conducted in Algeria [12] among Algerian university students. In that research, the Internet/social media (41.7%) and family/friends (25.4%) were the primary sources, with healthcare providers being less common (12.7%). The reliance on informal sources (the Internet, family) rather than healthcare providers is a common theme, suggesting a need for more authoritative as well as accessible health education channels. The study's strengths include a diverse sample and a comprehensive KAP assessment, as along with a multistage sampling method utilized to avoid bias. However, the cross-sectional design would limit causal inferences, and self-reported data may introduce bias. The reliance on internet-based information (41.8%) as a primary source of knowledge may raise concerns about information quality.
In summary, this study revealed a concerning landscape of suboptimal knowledge, prevalent misconceptions, and inadequate preventive practices regarding T2D among the student population, findings that are largely in accordance with several regional studies.
Conclusion
This study highlighted moderate diabetes-related knowledge, positive attitudes, and suboptimal practices among non-medical university students in southern Iraq, with significant gaps in understanding the pathophysiology, curability, and management of type 2 diabetes (T2D). Key factors linked to better diabetes-related KAP scores included older age, male gender, marital status, higher academic year, family history of T2D, attendance at diabetes-related workshops, and reliance on medical staff for information. These findings emphasize the need for targeted educational interventions to enhance diabetes awareness, especially regarding disease severity, prevention, and self-management practices. Strengthening health promotion initiatives such as university-based workshops as well as accessible medical guidance could elevate KAP levels and help curb the growing burden of T2D among young adults in Iraq and similar populations.
Acknowledgements
This work was partially supported by Southern Technical University under the Scientific Research Award (No. 9/7934, 10 September 2025).
Conflict of interest
None declared.
Funding
None
Ethical Considerations
This study complied with the Strengthening the Reporting of Observational Studies in Epidemiology (STROBE) guidelines for cross‑sectional studies [22]. Ethical approval was obtained from the Medical Ethics Committee and the Scientific Research Unit.
Code of Ethics
Ethical approval was obtained from the Institutional Review Board (IRB) of Southern Technical University (IRB‑STU 7/27/199, October 10, 2024).
Authors' Contributions
Saman A. Hashim: Conception and design, Data acquisition, Statistical analysis, Drafting of the manuscript, Obtaining funding, Administrative, technical, or material support, Supervision; Ja’far M. Alkhawaldeh: Conception and design, Drafting of the manuscript; Atheer K. Ibadi: Conception and design, Drafting of the manuscript; Mohd Y. Barakatun‑Nisak: Supervision; Haider A. Alidrisi: Supervision; Abbas A. Mansour: Critical revision of the manuscript for important intellectual content, Statistical analysis; Ibrahim A. Zaboon: Data analysis and interpretation. All authors contributed to writing—review and editing and approved the final manuscript.
References
1. Hossain MJ, Al-Mamun M, Islam MR. Diabetes mellitus, the fastest growing global public health concern: Early detection should be focused. Health Sci Rep. 2024;7(3):e2004. [DOI] [PMID] [PMCID]
2. Forray AI, Coman MA, Simonescu-Colan R, Mazga AI, Cherecheș RM, Borzan CM. The Global Burden of Type 2 Diabetes Attributable to Dietary Risks: Insights from the Global Burden of Disease Study 2019. Nutrients. 2023;15(21):4613. [DOI] [PMID] [PMCID]
3. Alsolais AM, Bajet JB, Alquwez N, Alotaibi KA, Almansour AM, Alshammari F, et al. Predictors of Self-Assessed and Actual Knowledge about Diabetes among Nursing Students in Saudi Arabia. J Pers Med. 2022;13(1):57. [DOI] [PMID] [PMCID]
4. Hashim SA, Barakatun-Nisak MY, Abu Saad H, Ismail S, Hamdy O, Mansour AA. Association of Health Literacy and Nutritional Status Assessment with Glycemic Control in Adults with Type 2 Diabetes Mellitus. Nutrients. 2020;12(10):3152. [DOI] [PMID] [PMCID]
5. Hwalla N, Jaafar Z, Sawaya S. Dietary Management of Type 2 Diabetes in the MENA Region: A Review of the Evidence. Nutrients. 2021;13(4):1060. [DOI] [PMID] [PMCID]
6. Yaaqoob BY, Kadhem SA. Evaluating the Level of Knowledge of University Students about Diabetes Mellitus. Health Educ Health Promot. 2023;11(1):173-80. [DOI]
7. Hashim SA, Al jassim NH, Mansour AA. Development of Simplified Diabetes Nutrition Education Tools for Patients with Type 2 Diabetes Mellitus in Basrah, Iraq. Int J Nutr Sci. 2025;10(2):314-24. [DOI]
8. Abusaib M, Ahmed M, Nwayyir HA, Alidrisi HA, Al-Abbood M, Al-Bayati A, et al. Iraqi Experts Consensus on the Management of Type 2 Diabetes/Prediabetes in Adults. Clin Med Insights Endocrinol Diabetes. 2020;13:1179551420942232. [DOI] [PMID] [PMCID]
9. Sękowski K, Grudziąż-Sękowska J, Pinkas J, Jankowski M. Public knowledge and awareness of diabetes mellitus, its risk factors, complications, and prevention methods among adults in Poland-A 2022 nationwide cross-sectional survey. Front Public Health. 2022;10:1029358. [DOI] [PMID] [PMCID]
10. Mangla P, Raizada N, Kaur H, Madhu SV. Diabetes awareness: Significant knowledge gap among medical and nursing students in Delhi. Southeast Eur J Public Health. 2025;27:993-1004. [DOI]
11. Hashim SA, Mohd Yusof BN, Abu Saad H, Ismail S, Hamdy O, Mansour AA: Effectiveness of simplified diabetes nutrition education on glycemic control and other diabetes-related outcomes in patients with type 2 diabetes mellitus. Clin Nutrition ESPEN. 2021;45:141-9. [DOI] [PMID]
12. Lounis M. Assessment of diabetes related-knowledge and practice among Algerian university students: a cross-sectional survey. Discov Public Health. 2024;21(1):66. [DOI]
13. Alsous M, Abdel Jalil M, Odeh M, Al Kurdi R, Alnan M. Public knowledge, attitudes and practices toward diabetes mellitus: A cross-sectional study from Jordan. PLoS One. 2019;14(3):e0214479. [DOI] [PMID] [PMCID]
14. Abdul Karim RA, Habib HA. Awareness Regarding Diabetes Risk Factors, Prevention and Management among Community Members in Diyala/Baqubah. AL-Kindy Col Med J. 2022;18(1):24-29. [DOI]
15. Khlaifat AM, Al-Hadid LA, Dabbour RS, Shoqirat N. Cross-sectional survey on the diabetes knowledge, risk perceptions and practices among university students in South Jordan. J Diabetes Metab Disord. 2020;19(2):849-58. [DOI] [PMID] [PMCID]
16. American Diabetes Association Professional Practice Committee for Diabetes. 2 Diagnosis and Classification of Diabetes: Standards of Care in Diabetes—2024. Diabetes Care. 2024;47(Suppl 1):S20-42. [DOI] [PMID] [PMCID]
17. Al-Hussaini M, Mustafa S. Adolescents' knowledge and awareness of diabetes mellitus in Kuwait. Alexandria J Med. 2016;52(1):61-6. [DOI]
18. Asmar I, Almahmoud O, Qoud B, Assaf M, Saleh AD, Alyan A, et al. Diabetes knowledge, attitudes and practices among university students in a developing country. J Diabetes Nurs. 2024;28(3):1-7.
19. Gazzaz ZJ. Knowledge, Attitudes, and Practices Regarding Diabetes Mellitus among University Students in Jeddah, Saudi Arabia. Diabetes Metab Syndr Obes. 2020;23:5071-8. [DOI] [PMID] [PMCID]
20. Johnson C, Obanor N. Assessing Diabetes Knowledge, Attitudes and Behaviors of College Students. Am J Med Public Health. 2020;1(2):1007.
21. Khan N, Gomathi KG, Shehnaz SI, Muttappallymyalil J. Diabetes Mellitus-Related Knowledge among University Students in Ajman, United Arab Emirates. Sultan Qaboos Univ Med J. 2012;12(3):306-14. [DOI] [PMID] [PMCID]
22. Austrian Development Agency. Guidelines for Project and Programme Evaluation: final draft. Vienna, Austria: Austrian Development Agency; 2009.
Send email to the article author
| Rights and permissions | |
 |
This work is licensed under a Creative Commons Attribution 4.0 International License. |