Journal of Occupational
Health and Epidemiology

Rafsanjan university Of medical sciences
Volume 15, Issue 2 (Spring 2026)
J Occup Health Epidemiol 2026, 15(2): 152-160 |
Back to browse issues page




Download citation:
BibTeX | RIS | EndNote | Medlars | ProCite | Reference Manager | RefWorks
Send citation to:


BibTeX | RIS | EndNote | Medlars | ProCite | Reference Manager | RefWorks
Send citation to:
Pakgohar A, Moradeskandari R. Comparative Analysis of Statistical and Data Mining Approaches for Epidemiological Assessment of Multi-Hazard Occupational Exposures: A Case Study in a Large Industrial Setting. , J Occup Health Epidemiol. 2026; 15 (2) :152-160
URL: http://johe.rums.ac.ir/article-1-1116-en.html
URL: http://johe.rums.ac.ir/article-1-1116-en.html
Related article in
Google Scholar
Google Scholar
Similar articles


1- Assistant Prof., Dept. of Statistics, Payame Noor University, Tehran, Iran. , a_pakgohar@pnu.ac.ir
2- M.Sc. in Chemical Engineering, Health, Safety and Environment, Chadormalou Steel Factory, Ardakan, Iran.
2- M.Sc. in Chemical Engineering, Health, Safety and Environment, Chadormalou Steel Factory, Ardakan, Iran.
Article history

Received: 2026/02/24
Accepted: 2026/05/9
ePublished: 2026/06/30
Accepted: 2026/05/9
ePublished: 2026/06/30
Subject:
Occupational Health
Keywords: Occupational Exposure [MeSH], Decision Trees [MeSH], Analysis of Variance [MeSH], Risk Assessment [MeSH], Data Mining [MeSH], Occupational Health [MeSH]
Full-Text [PDF 312 kb]
(115 Downloads)
| Abstract (HTML) (331 Views)
The primary dependent variable is the Exposure Severity Ratio (ESR), a continuous metric calculated as the ratio of the measured exposure value to its corresponding Occupational Exposure Limit (OEL).
Across industrial environments, occupational exposures rarely take place in isolation; workers face concurrent multi-hazard conditions. In order to address the inherent heterogeneity of physical, chemical, and ergonomic measurements, raw exposure levels were mathematically standardized using the Exposure Severity Ratio (ESRESRESR). Through computing ESR=MeasuredValue/OEL, disparate metrics (e.g., dB, mg/m3) were transformed into a uniform, dimensionless severity index. This transformation not only establishes
a solid statistical foundation for cross-hazard comparison but also justifies the application of non-linear data mining algorithms, such as CHAID, which excel at identifying complex interactions within highly heterogeneous datasets.
Data Cleaning and Validation: The dataset was derived from validated official HSE assessment reports, ensuring high initial data quality and consistency; thus, no records were excluded owing to measurement errors or inconsistent values.
The data reduction process was strictly limited to a frequency-based threshold. For guaranteeing statistical robustness and avoid model overfitting, hazard categories with insufficient sample sizes (n < 10) were excluded. This step was methodologically essential, as sparse data points would compromise the validity of Chi-square tests (violating expected frequency assumptions) and introduce instability into the CHAID decision tree structure.
Hence, only specific rare exposure categories—such as Zinc (n=2), Oil Mist (n=1), Hand-Arm Vibration (n=1), as well as isolated magnetic field scenarios (n=3)—were omitted from the analysis. Following this specific filtration, the final analytical dataset comprised N = 647 cases. A comprehensive breakdown of the retained hazard categories and their descriptive statistics is reported in Table 1.
The justification for these specific thresholds is twofold. Statistically, setting the minimum terminal node size to 30 ensures sufficient sample size to maintain the validity and statistical power of the consecutive Chi-squared tests (α = 0.05, incorporating Bonferroni adjustments) employed for splitting. This aligns with our initial data curation step, where variables with n < 10 were excluded to prevent violation of Chi-square expected-frequency assumptions. Practically, restricting the tree depth to 3 and avoiding "micro-nodes" (nodes with <30 cases) would prevent over-stratification and overfitting. This ensures that the terminal nodes represent substantial, actionable target groups rather than statistical anomalies, thereby providing HSE management with viable clusters for intervention.
Further, to guarantee generalizability and reliability of the generated decision tree, a 10-fold cross-validation technique was employed. This rigorous validation approach confirmed the stability of the model structure, yielding a highly acceptable misclassification error rate of 12.4%, thereby substantiating the validity of the identified risk profiles.
Framework for Comparative Analysis: In order to address the core objective of the study, the comparative analysis between the two methodological paradigms is systematically ascertained based on three predefined criteria:
Analytical Capability and Interaction Detection: Classical statistics (ANOVA) appraise main effects and linear differences among groups. In contrast, the CHAID model’s superiority is assessed based upon its capacity to autonomously identify high-risk subgroups formed by the synergistic interaction of multiple simultaneous hazards (e.g., the combined effect of noise and thermal stress in specific smelting roles) often obscured by linear models.
Assumption Constraints: The performance of the approaches is compared considering data distribution. Classical methods require strict parametric assumptions (e.g., normality, homogeneity of variance), while the CHAID algorithm’s non-parametric nature is ascertained for its robustness in handling real-world, skewed HSE data without requiring transformations.
Interpretability and Practical Utility for HSE Management: The ultimate comparative metric is the operational value of the outputs. While statistical models provide abstract p-values and effect sizes, the decision tree is appraised on its ability to generate visual, hierarchical rule sets (If-Then scenarios) that directly translate into actionable risk prioritization and targeted intervention strategies for industrial managers.
Results
Records spanned 50+ distinct job roles across 15 primary units (Foundry, Melting Shop, Heavy Machinery, Transport, Refractory, Maintenance, HSE, Administration, etc.).
Frequency of measured environmental hazards: Dust and Silica (22%), Noise (24%), Chemical heavy metals (Mn, Cd, Cr, Pb, Fe, Zn) (21%), Ergonomics (10%), Light and IR Radiation (infrared and ultraviolet) (18%), thermal stress, and whole-body vibration (WBV) (5%). Other hazards (UV, Vibration, Lighting, Magnetic Fields, Oil Mist) comprised <1% (Table 1).
Table 1 outlines the descriptive characteristics of the research samples included min, max, mean ( , standard deviation (SD), skewness, and kurtosis in the research factors. Table 2 presents C.I and P-Value of one sample T test. As detailed in Table 2, the statistical comparison of mean exposures against standard limits was primarily undertaken using the independent sample t-test. However, preliminary assumption checks (skewness and kurtosis) indicated that the distribution of ESR for certain specific chemical agents, such as Lead (Pb), significantly deviated from normality. Hence, to maintain statistical rigor, the non-parametric Median test was applied for these specific variables (denoted by * in Table 2) as a robust alternative to evaluate their central tendencies. Based on Table 2, the results of statistic tests demonstrated that there was a significant difference in the heavy metals level such as Cadmium (Cd), Chromium (Cr), Iron (Fe) and Lead (Pb) of the chemical factors respect to the permissible exposure limit (P<0.001). Nevertheless, manganese (P=0.180), Free Silica (P=0.504) as the heavy metals as well as Dust (P=0.834) have been within the range of permissible exposure limit. In the physical factors, Light and infrared (P<0.001), besides Noise (P=0.007) have a
significant difference with the permissible exposure limit. Nevertheless, the ultraviolet (P=0.262) and WBV (P=0.195) are in the range of permissible exposure limit. Eventually, the ergonomic and psychological factors have a significant difference with respect to permissible exposure limit (P<0.001).
Table 2. T-test and C.I for Measured exposure and ESR variables
Table 3. Output of Scheffe Post-Hoc ANOVA Test for ESR Variable
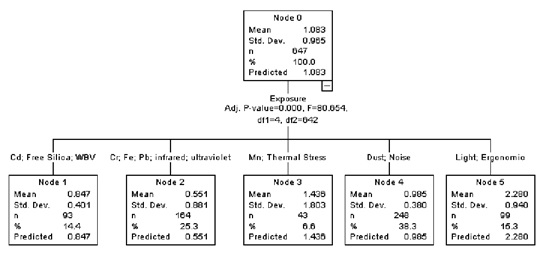
Fig. 1. CHAID Output Classified diagram of ESR Variable
The mean exposure ratio across all observations was 1.083 (SD=0.965), revealing a slight exceedance (8%) of regulatory limits. This suggests that, on aggregate, measured exposures were so marginally higher than established safety thresholds.
Risk Stratification (Exposure Split): The most significant partition divided the cohort based on exposure to specific hazard combinations:
Compliant Group: Exposure to the heavy metals risk factors included Pb, Fe, Cr, as well as the physical risk factors: Ultraviolet Radiation including infrared and ultraviolet, was linked to the lowest exposure ratio. Comprising 61% of the workforce (n=396), this group demonstrated the best compliance, with a mean ratio of 0.551 ± 0.881 (Mean ± SD). Rather than definitively proving the efficacy of specific engineering controls—which cannot be established solely through cross-sectional data—this low exposure level demonstrates a favorable current state within this subset (Node 2, Fig. 1). This state may be associated with existing workplace interventions or the appropriate usage of personal protective equipment (PPE), though longitudinal studies are essential to confirm causality.
Subthreshold -Compliance Group: Exposure to the heavy metals risk factors including Free Silica and Cd, beside WBV, was tied to the Subthreshold -Compliance exposure ratio. Node 1 comprised 175 participants (27% of the total sample). This group showed moderate compliance, with a mean exposure-to-regulatory-limit ratio of 0.847 ± 0.401, indicating that exposures were partly below the regulatory limits (Fig. 1).
Threshold-Level Group: The analysis identified several factors operating at the threshold of permissible exposure limits:
Dust and Noise exposures exhibited a ratio of 0.995 ± 0.380 (Mean ± SD). While these exposure levels currently remain within regulatory compliance (ratio ≤1), their proximity to the threshold warrants careful consideration (Node 4, Fig. 1).
Elevated-Risk: Exposure to Mn and thermal stress was linked to the high-risk exposure ratio. This group demonstrated a moderate risk, with a mean ratio of 1.436± 1.803, signifying exposures greater than regulatory limits (Node 3, Fig. 1).
Highest-Risk Group: The combination of light and ergonomic factors led to the highest exposure ratio above the regulatory limit. This highlights the need for targeted interventions in such scenarios (Node 5, Fig. 1).
Comparative Analysis of Statistical and Data Mining Approaches: While classical statistical tests and the CHAID algorithm were applied to the same occupational health dataset, they yielded complementary insights rather than conflicting outputs. A structured comparison of their results well indicates how the two methodologies validate and augment one another:
Convergence and Validation of Findings: The findings from both methodologies strongly corroborated one another regarding identification of high-risk exposures. The classical ANOVA with Scheffe's post-hoc analysis (Table 3) isolated 'Light' (Mean ESR = 2.38) and 'Ergonomic' hazards (Mean ESR = 2.22) as the most severe individual risk factors, clustering them in the highest-risk subset (Subset 4). Correspondingly, the CHAID decision tree validated this statistical finding through populating its 'Non-Compliant/High-Risk' terminal nodes with observations primarily driven by these specific physical and ergonomic extremes. This structural agreement proves that both models precisely converge on identifying the primary sources of occupational risk.
Complementary Perspectives (Variable-Centric vs. Population-Centric): In spite of their convergence, the two approaches provided fundamentally different, yet complementary, practical perspectives. Classical approaches (T-test and ANOVA) excelled in a variable-centric analysis; they rigorously ascertained the isolated severity of each hazard against occupational limits (Table 2) and established strict confidence intervals. Nevertheless, classical tests failed to capture the workforce distribution across these risks. Conversely, the CHAID model contributed a population-centric perspective. Instead of merely ranking hazard severity, the data mining approach dynamically segmented the workforce. It demonstrated the actionable insight that despite the presence of statistically severe hazards, 61% of the observed workforce safely fell into the 'Compliant' zone, while 27% lingered in a vulnerable 'Subthreshold' zone.
Methodological Advantages in Hazard Assessment: Further, whereas ANOVA inherently assumed independent group means and linear comparisons, CHAID successfully navigated the dataset without requiring rigid parametric assumptions. This is particularly crucial since assumption checks entailed non-parametric alternatives (Median tests) for highly skewed variables such as Lead (Pb) and Noise. CHAID inherently bypassed these distributional limitations, mapping out exact, data-driven cutoff points for exposure severity.
Discussion
In synthesis, classical statistics identified exactly what the most critical hazards were and to what extent they deviated from standard limits. On the other hand, the CHAID data mining approach visualized who was affected, how the workforce was stratified, and where safety interventions should be strategically prioritized by HSE management.
The findings demonstrated a critical dichotomy in the safety profile of the Chadormalu industrial complex. While chemical hazards such as Fe, Cr, and Pb were generally well-controlled, possibly reflecting the efficacy of established engineering controls and ventilation systems for specific agents [7-9], physical and ergonomic stressors emerged as severe, persistent challenges [1,18]. The mechanistic reasons behind these patterns are deeply rooted in the operational realities of the site. The severe exceedance ratios (ESR>2.0) noted for Light/Infrared (IR) radiation are a direct consequence of the workforce’s proximity to melting shops, furnaces, as well as continuous thermal operations, where radiant heat and intense light are inescapable byproducts. Likewise, the pronounced ergonomic deviations are intrinsic to the heavy industrial context; tasks demanding the operation of heavy machinery, manual material handling of massive components, and the sustained awkward, static postures frequently assumed by maintenance crews drive these extreme ergonomic challenges.
These observations largely align with recent epidemiological examinations in the mining and steel manufacturing sectors. Contemporary studies, including Golmohammadi and Darvishi [1] and studies on mining ergonomics [18] have reported that while chemical airborne exposures in modernized steelworks are increasingly mitigated [7-9], physical and ergonomic burdens remain disproportionately high [1,18]. Nevertheless, the methodological novelty of our research lies in moving beyond the limitations of these prior studies [1,6,18]. Whereas previous literature has predominantly ascertained occupational hazards in isolation [7-9,18], our application of the CHAID algorithm illuminates the interactive and synergistic effects of combined stressors that conventional single-agent monitoring often fails to capture [1,6]. This accords with the limitations of classical T-tests used in our initial analysis, which confirmed significant violations (p<0.05) across the board but missed the critical nuance of compounding vulnerabilities [1,6].
Therefore, do not interpret CHAID terminal nodes merely as average exposure values. Each node represents a distinct subgroup of workers with a specific combination of hazard types, job roles, and exposure severity. These combinations form multidimensional risk profiles that help HSE managers prioritize targeted interventions.
The algorithm successfully mapped the complex, non-linear interactions between distinct hazard clusters and job categories. Operationally, these terminal nodes serve as diagnostic tools that pinpoint critical organizational “hot-spots.” This empowers HSE management to transition from generic, plant-wide safety protocols, which often result in an inefficient, equal distribution of safety budgets, to highly targeted, cost-effective interventions. Through strategically prioritizing localized engineering controls and customized interventions specifically for the high-risk intersections identified by CHAID (e.g., specific job roles facing concurrent noise and ergonomic strain), the complex can address the urgent gap between theoretical protection (based on PPE issuance) and actual exposure levels.
In spite of the robust methodological framework and the novel application of the CHAID decision tree algorithm, this study has been subject to several limitations that warrant acknowledgment. First, the research employed a cross-sectional design, which inherently restricts the ability to establish causal relationships or monitor the cumulative, longitudinal health impacts of multi-hazard exposures over time. Further, the dataset was exclusively derived from a single, albeit massive, steel manufacturing and mining complex in Iran. Hence, the external validity and generalizability of the findings to other industrial sectors or geographic regions—which may operate under different occupational health regulations or climatic conditions—should be approached with caution.
Also, occupational exposure measurements, especially for dynamic environmental factors such as thermal stress and lighting, represent temporal snapshots. These variables are highly susceptible to seasonal and diurnal variations that may not be fully captured in a single cross-sectional measurement phase. Ultimately, while we rigorously standardized all hazard types into a unified dimensionless index (ESR), the primary data collection for ergonomic and psychosocial factors relied on semi-quantitative observational tools. These methods inherently carry a degree of subjectivity compared to the precision of direct-reading instruments utilized for physical and chemical agents.
Future research endeavors should prioritize longitudinal cohort designs to capture temporal exposure dynamics and incorporate seasonal variations. Further, applying advanced ensemble machine learning techniques, such as Random Forests or Gradient Boosting, could build upon the foundational non-linear interactions identified by the CHAID model in this study, thereby enhancing the predictive accuracy of occupational risk profiling. Future research should incorporate longitudinal exposure monitoring for validating the causal links suggested by this cross-sectional analysis. Also, incorporating cost-benefit analyses of advanced engineering controls could provide the financial justification required to bridge the gap between risk identification and mitigation.
Conclusion
This study successfully indicated that integrating classical statistical methods with the CHAID data mining algorithm provides a more robust framework for occupational risk assessment than either method alone. While classical statistics (T-test/ANOVA) rigorously quantified the severity of hazards—identifying light and ergonomic factors as the most critical violations—the CHAID model effectively stratified the workforce, uncovering that 61% of personnel operate within compliant zones in spite of high average risk levels in specific pockets. The results dictate a necessary paradigm shift for HSE management: moving from broad-spectrum monitoring to targeted interventions. Immediate priority should be given to higher-level controls (Elimination and Engineering) for noise and ergonomic hazards, as reliance on PPE has proven insufficient for high-risk subgroups.
Acknowledgments
The authors would like to express their sincere gratitude to the HSE management and staff of Chadormalu Steel Factory for their cooperation and for providing the anonymized HSE dataset used in this study. The authors also thank the Department of Statistics, Payame Noor University, for technical support.
Conflict of interest
None declared.
Funding
This research did not receive any specific grant from funding agencies in the public, commercial, or not-for-profit sectors.
Ethical Considerations
Strict protocols were implemented to safeguard the privacy and confidentiality of the personnel whose data were utilized in this study. Prior to data extraction and analysis, the facility's central HSE department completely anonymized the dataset. All direct personal identifiers—including names, employee identification numbers, and contact information—were removed. The research team was exclusively provided with a de-identified dataset categorized solely by operational departments and hazard exposure metrics. Further, all findings in this study are reported in an aggregated format, ensuring that no individual worker's health or exposure status can be traced or inferred from the published results.
Code of Ethics
This cross-sectional study used only routinely collected, de-identified occupational exposure data. No human participants were directly involved, and no personal identifiers were accessible to the research team. The study was therefore exempt from formal ethical approval according to the institutional ethics policy; nevertheless, all data handling procedures complied with national research ethics regulations.
Authors' Contributions
Alireza Pakgohar: Conceptualization, Methodology, Formal analysis, Data curation, Writing – original draft, Writing – review & editing, Supervision; Reza Moradeskandari: Conceptualization, Investigation, Resources, Data curation.
Full-Text: (24 Views)
Introduction
Substantial evidence demonstrates that occupational exposure to hazardous substances and environments regulated by Health, Safety, and Environment (HSE) standards significantly influences worker health across multiple domains. Heavy industries—including manufacturing, construction, mining, and steel production—create complex occupational environments where workers are exposed to multifaceted hazards. These risks encompass physical agents (such as noise, whole-body vibration, and radiation), chemical exposures (solvents, heavy metals, dust), psychological stressors, and ergonomic challenges. Critically, the synergistic interactions of these hazards often amplify health risks beyond the impact of individual exposures [1, 2].
Based on global epidemiological data, these exposures pose substantial risks [3]. Among physical hazards, industrial noise remains one of the most pervasive, affecting approximately 22 million U.S. workers. Beyond irreversible cochlear damage, noise exposure is significantly linked to cardiovascular disease [4] as well as varying prevalence rates of hearing loss in diverse sectors, such as fisheries [5]. Moreover, the assessment of physical factors that exacerbate psychological effects, particularly thermal stress, is becoming increasingly crucial. Exposure to extreme temperatures impairs cognitive performance and safety through contributing to mental fatigue and reducing alertness, while psychological factors such as shift work can disrupt circadian rhythms, potentially heightening depression rates and impairing function [1, 3].
Chemical agents represent another formidable category of hazards. A systematic review by Issah et al. highlighted the complexity of real-world exposures involving metal mixtures (e.g., mercury, arsenic, cadmium, lead, manganese), establishing consistent associations with adverse pregnancy and birth outcomes [6]. Specific agents such as respirable crystalline silica and hexavalent chromium persistently pose severe risks, including silicosis [7] and carcinogenic systemic toxicity [8]. Moreover, chemical exposures are linked to broader systemic issues, including cardiovascular diseases and hypertension [9].
The landscape of occupational health is also shifting with emerging industries. For instance, the cannabis production sector introduces novel physical, chemical, and biological hazards often lacking established exposure standards [10]. Likewise, specific occupational groups confront unique profiles; sanitation workers suffer high rates of respiratory and gastrointestinal diseases [11], with informal street food vendors being vulnerable to environmental pollutants [12]. Recent research has even identified a novel biological dimension, suggesting that occupational factors can alter the human microbiota, influencing disease susceptibility [13]. Other sectors, such as healthcare, confront multifactorial risks requiring robust control strategies [14]. While conditions such as hypersensitivity pneumonitis [15], carbon monoxide poisoning [16], and even infantile hypertrophic pyloric stenosis [17] emphasize the breadth of environmental etiology, specific attention to ergonomics in mining remains critical for preventing musculoskeletal disorders [18].
In spite of existence of Occupational Exposure Limits (OELs) for agents such as noise (85 dBA), manganese, and silica, residual risks persist. Epidemiological appraisal of control effectiveness in real-world settings
is therefore crucial. This study analyzes a comprehensive dataset from the Chadormalu Industrial Corporation, one of the largest iron ore mining and steel production complexes in the Middle East. Located in Ardakan, Iran, and employing over 5,000 workers, the facility presents a high-risk environment involving smelting and heavy machinery.
In order to comprehensively ascertain these residual risks, this study adopts a hybrid methodological framework. We combine classical inferential statistics to test mean exposure compliance against OELs with data mining techniques. Specifically, we utilize CHAID (Chi-squared Automatic Interaction Detection) decision tree algorithms. Decision trees are valuable for their interpretability in classification tasks, and their application has been well-documented in analyzing risk factors and accident causes [19-21]. This approach enables identification of non-linear interactions between hazard types and job roles, bridging theoretical compliance with actionable intervention priorities.
Materials and Methods
The primary objective of this study has been to conduct a comparative analysis between classical inferential statistics and data mining techniques in ascertaining occupational exposure to multifaceted environmental hazards. Rather than viewing these methods as mutually exclusive, this study proposes a complementary analytical framework. Classical statistics (e.g., One-sample t-tests, ANOVA) are applied for rigorous hypothesis testing and baseline compliance assessment against standards. Conversely, data mining, specifically the CHAID decision tree algorithm, is utilized to uncover complex, non-linear interactions among multiple hazards as well as to generate practical risk stratification models. Ultimately, this comparative approach aims to provide robust, evidence-based guidelines for HSE analysts together with managers.
Data Source and Variables: This study leveraged data derived from the facility’s comprehensive annual HSE assessment undertaken in 2025. To guarantee the representativeness of the findings and to capture the diverse hazard profiles inherent to the plant's complex topography, a stratified random sampling strategy was applied in lieu of a simple census. The facility was stratified by its functional departments, serving as distinct operational clusters. Within each stratum (department), a representative sample of operational workers and technical personnel was selected at random for HSE metric assessment. This methodological approach ensures that the dataset accurately reflects the facility-wide distribution of risks, thereby confirming the external validity of the subsequent analytical models.
The dataset encompasses a broad spectrum of
occupational hazard factors. Independent variables were operationalized as categorical data representing specific exposure types, including:
Substantial evidence demonstrates that occupational exposure to hazardous substances and environments regulated by Health, Safety, and Environment (HSE) standards significantly influences worker health across multiple domains. Heavy industries—including manufacturing, construction, mining, and steel production—create complex occupational environments where workers are exposed to multifaceted hazards. These risks encompass physical agents (such as noise, whole-body vibration, and radiation), chemical exposures (solvents, heavy metals, dust), psychological stressors, and ergonomic challenges. Critically, the synergistic interactions of these hazards often amplify health risks beyond the impact of individual exposures [1, 2].
Based on global epidemiological data, these exposures pose substantial risks [3]. Among physical hazards, industrial noise remains one of the most pervasive, affecting approximately 22 million U.S. workers. Beyond irreversible cochlear damage, noise exposure is significantly linked to cardiovascular disease [4] as well as varying prevalence rates of hearing loss in diverse sectors, such as fisheries [5]. Moreover, the assessment of physical factors that exacerbate psychological effects, particularly thermal stress, is becoming increasingly crucial. Exposure to extreme temperatures impairs cognitive performance and safety through contributing to mental fatigue and reducing alertness, while psychological factors such as shift work can disrupt circadian rhythms, potentially heightening depression rates and impairing function [1, 3].
Chemical agents represent another formidable category of hazards. A systematic review by Issah et al. highlighted the complexity of real-world exposures involving metal mixtures (e.g., mercury, arsenic, cadmium, lead, manganese), establishing consistent associations with adverse pregnancy and birth outcomes [6]. Specific agents such as respirable crystalline silica and hexavalent chromium persistently pose severe risks, including silicosis [7] and carcinogenic systemic toxicity [8]. Moreover, chemical exposures are linked to broader systemic issues, including cardiovascular diseases and hypertension [9].
The landscape of occupational health is also shifting with emerging industries. For instance, the cannabis production sector introduces novel physical, chemical, and biological hazards often lacking established exposure standards [10]. Likewise, specific occupational groups confront unique profiles; sanitation workers suffer high rates of respiratory and gastrointestinal diseases [11], with informal street food vendors being vulnerable to environmental pollutants [12]. Recent research has even identified a novel biological dimension, suggesting that occupational factors can alter the human microbiota, influencing disease susceptibility [13]. Other sectors, such as healthcare, confront multifactorial risks requiring robust control strategies [14]. While conditions such as hypersensitivity pneumonitis [15], carbon monoxide poisoning [16], and even infantile hypertrophic pyloric stenosis [17] emphasize the breadth of environmental etiology, specific attention to ergonomics in mining remains critical for preventing musculoskeletal disorders [18].
In spite of existence of Occupational Exposure Limits (OELs) for agents such as noise (85 dBA), manganese, and silica, residual risks persist. Epidemiological appraisal of control effectiveness in real-world settings
is therefore crucial. This study analyzes a comprehensive dataset from the Chadormalu Industrial Corporation, one of the largest iron ore mining and steel production complexes in the Middle East. Located in Ardakan, Iran, and employing over 5,000 workers, the facility presents a high-risk environment involving smelting and heavy machinery.
In order to comprehensively ascertain these residual risks, this study adopts a hybrid methodological framework. We combine classical inferential statistics to test mean exposure compliance against OELs with data mining techniques. Specifically, we utilize CHAID (Chi-squared Automatic Interaction Detection) decision tree algorithms. Decision trees are valuable for their interpretability in classification tasks, and their application has been well-documented in analyzing risk factors and accident causes [19-21]. This approach enables identification of non-linear interactions between hazard types and job roles, bridging theoretical compliance with actionable intervention priorities.
Materials and Methods
The primary objective of this study has been to conduct a comparative analysis between classical inferential statistics and data mining techniques in ascertaining occupational exposure to multifaceted environmental hazards. Rather than viewing these methods as mutually exclusive, this study proposes a complementary analytical framework. Classical statistics (e.g., One-sample t-tests, ANOVA) are applied for rigorous hypothesis testing and baseline compliance assessment against standards. Conversely, data mining, specifically the CHAID decision tree algorithm, is utilized to uncover complex, non-linear interactions among multiple hazards as well as to generate practical risk stratification models. Ultimately, this comparative approach aims to provide robust, evidence-based guidelines for HSE analysts together with managers.
Data Source and Variables: This study leveraged data derived from the facility’s comprehensive annual HSE assessment undertaken in 2025. To guarantee the representativeness of the findings and to capture the diverse hazard profiles inherent to the plant's complex topography, a stratified random sampling strategy was applied in lieu of a simple census. The facility was stratified by its functional departments, serving as distinct operational clusters. Within each stratum (department), a representative sample of operational workers and technical personnel was selected at random for HSE metric assessment. This methodological approach ensures that the dataset accurately reflects the facility-wide distribution of risks, thereby confirming the external validity of the subsequent analytical models.
The dataset encompasses a broad spectrum of
occupational hazard factors. Independent variables were operationalized as categorical data representing specific exposure types, including:
- Physical Agents: Noise, Thermal Stress, Lighting, Whole-Body Vibration (WBV), and Radiation (Infrared/Ultraviolet).
- Chemical Agents: General Dust, Crystalline Silica, Heavy Metals (Cr, Pb, Fe, Cd, Mn), and Welding Fumes.
- Ergonomic Factors: Postural and manual handling risks.
The primary dependent variable is the Exposure Severity Ratio (ESR), a continuous metric calculated as the ratio of the measured exposure value to its corresponding Occupational Exposure Limit (OEL).
Across industrial environments, occupational exposures rarely take place in isolation; workers face concurrent multi-hazard conditions. In order to address the inherent heterogeneity of physical, chemical, and ergonomic measurements, raw exposure levels were mathematically standardized using the Exposure Severity Ratio (ESRESRESR). Through computing ESR=MeasuredValue/OEL, disparate metrics (e.g., dB, mg/m3) were transformed into a uniform, dimensionless severity index. This transformation not only establishes
a solid statistical foundation for cross-hazard comparison but also justifies the application of non-linear data mining algorithms, such as CHAID, which excel at identifying complex interactions within highly heterogeneous datasets.
Data Cleaning and Validation: The dataset was derived from validated official HSE assessment reports, ensuring high initial data quality and consistency; thus, no records were excluded owing to measurement errors or inconsistent values.
The data reduction process was strictly limited to a frequency-based threshold. For guaranteeing statistical robustness and avoid model overfitting, hazard categories with insufficient sample sizes (n < 10) were excluded. This step was methodologically essential, as sparse data points would compromise the validity of Chi-square tests (violating expected frequency assumptions) and introduce instability into the CHAID decision tree structure.
Hence, only specific rare exposure categories—such as Zinc (n=2), Oil Mist (n=1), Hand-Arm Vibration (n=1), as well as isolated magnetic field scenarios (n=3)—were omitted from the analysis. Following this specific filtration, the final analytical dataset comprised N = 647 cases. A comprehensive breakdown of the retained hazard categories and their descriptive statistics is reported in Table 1.
Table 1. Descriptive Statistics of Variables
| Variable | Factor | Unit | OEL | N | Min | Max | Skewness | Kurtosis |
| Chemical | Cd | mg/m3 | 0.01 | 27 | 0 | 0.093 | -0.399 | -1.994 |
| Cr | mg/m3 | 0.5 | 27 | 0 | 0465 | -0.399 | -1.994 | |
| Fe | mg/m3 | 5 | 27 | 0.114 | 5.18 | -0.468 | -1.561 | |
| Mn | mg/m3 | 0.1 | 27 | 0 | 0.8 | 2.107* | 3.664* | |
| Pb | mg/m3 | 0.05 | 27 | 0 | 0.46 | -0.416 | -1.960 | |
| Dust | mg/m3 | 3 | 130 | 0.4 | 7,38 | 0.273 | -0.110 | |
| Free Silica | mg/m3 | 0.025 | 11 | 0.006 | 0.039 | -0.113 | -1.749 | |
| Physical | WBV | m/s2 | 0.87 | 20 | 0.15 | 1.26 | -0.452 | -0.895 |
| Light | Lux | 300 | 32 | 41 | 1489 | 0.390 | -0.872 | |
| Noise | db | 85 | 153 | 57.7 | 97.3 | -1.640 | 2.103 | |
| infrared | mw/cm2 | 10 | 45 | 0 | 19.1 | 1.890 | 1.774 | |
| ultraviolet | mw/cm2 | 1 | 38 | 0 | 81 | 3.151* | 12.134* | |
| Ergonomic | - | RULA | 2 | 67 | 3 | 7 | 0.886 | 0.470 |
| psychosocial | Thermal Stress | C | 28 | 16 | 26 | 37 | -0.883 | -0.576 |
*Distribution of sample mean is assumed not to be normal
Classical Statistical Analysis: Descriptive statistics—including frequencies, means, standard deviations, minimum/maximum values, and standard errors, were initially computed for profiling the risk severity across physical, chemical, psychosocial, and ergonomic hazard domains. For hypothesis testing:
One-Sample T-tests was employed to appraise the statistical significance of the mean differences between actual exposure levels and their respective OELs. For variables violating the assumption of normality (skewness or kurtosis >2), the non-parametric Median test was applied as a robust alternative.
One-Way ANOVA was utilized to ascertain the significance of mean differences in hazard severity across predefined risk groups and occupational roles.
All statistical significance thresholds were set a priori at α=0.05. Analyses were undertaken using Microsoft Excel 2016 and IBM SPSS Statistics version 26.0.
Data Mining Approach: CHAID Modeling: In order to analyze multi-factorial interactions among occupational hazards, the CHAID algorithm was implemented via SPSS 26.0. Unlike traditional linear models, CHAID facilitates the concurrent analysis of categorical predictors (hazard types, job roles) and quantitative outcomes (ESR values) through consecutive chi-squared tests, enabling the visualization of risk stratification.
In order to prevent model overfitting and ensure generalizability, the algorithmic parameters were strictly configured as follows:
One-Sample T-tests was employed to appraise the statistical significance of the mean differences between actual exposure levels and their respective OELs. For variables violating the assumption of normality (skewness or kurtosis >2), the non-parametric Median test was applied as a robust alternative.
One-Way ANOVA was utilized to ascertain the significance of mean differences in hazard severity across predefined risk groups and occupational roles.
All statistical significance thresholds were set a priori at α=0.05. Analyses were undertaken using Microsoft Excel 2016 and IBM SPSS Statistics version 26.0.
Data Mining Approach: CHAID Modeling: In order to analyze multi-factorial interactions among occupational hazards, the CHAID algorithm was implemented via SPSS 26.0. Unlike traditional linear models, CHAID facilitates the concurrent analysis of categorical predictors (hazard types, job roles) and quantitative outcomes (ESR values) through consecutive chi-squared tests, enabling the visualization of risk stratification.
In order to prevent model overfitting and ensure generalizability, the algorithmic parameters were strictly configured as follows:
- Significance Level for Splitting/Merging: α=0.05 (incorporating Bonferroni adjustments).
- Minimum Node Limits: Parent node = 60 cases; Child node = 30 cases (ensuring meaningful subgroup formation as per predefined protocol).
- Maximum Tree Depth: Restricted to 3 levels.
- Validation: A 10-fold cross-validation method was applied, yielding a satisfactory misclassification error rate of 12.4%, confirming the model’s predictive reliability.
The justification for these specific thresholds is twofold. Statistically, setting the minimum terminal node size to 30 ensures sufficient sample size to maintain the validity and statistical power of the consecutive Chi-squared tests (α = 0.05, incorporating Bonferroni adjustments) employed for splitting. This aligns with our initial data curation step, where variables with n < 10 were excluded to prevent violation of Chi-square expected-frequency assumptions. Practically, restricting the tree depth to 3 and avoiding "micro-nodes" (nodes with <30 cases) would prevent over-stratification and overfitting. This ensures that the terminal nodes represent substantial, actionable target groups rather than statistical anomalies, thereby providing HSE management with viable clusters for intervention.
Further, to guarantee generalizability and reliability of the generated decision tree, a 10-fold cross-validation technique was employed. This rigorous validation approach confirmed the stability of the model structure, yielding a highly acceptable misclassification error rate of 12.4%, thereby substantiating the validity of the identified risk profiles.
Framework for Comparative Analysis: In order to address the core objective of the study, the comparative analysis between the two methodological paradigms is systematically ascertained based on three predefined criteria:
Analytical Capability and Interaction Detection: Classical statistics (ANOVA) appraise main effects and linear differences among groups. In contrast, the CHAID model’s superiority is assessed based upon its capacity to autonomously identify high-risk subgroups formed by the synergistic interaction of multiple simultaneous hazards (e.g., the combined effect of noise and thermal stress in specific smelting roles) often obscured by linear models.
Assumption Constraints: The performance of the approaches is compared considering data distribution. Classical methods require strict parametric assumptions (e.g., normality, homogeneity of variance), while the CHAID algorithm’s non-parametric nature is ascertained for its robustness in handling real-world, skewed HSE data without requiring transformations.
Interpretability and Practical Utility for HSE Management: The ultimate comparative metric is the operational value of the outputs. While statistical models provide abstract p-values and effect sizes, the decision tree is appraised on its ability to generate visual, hierarchical rule sets (If-Then scenarios) that directly translate into actionable risk prioritization and targeted intervention strategies for industrial managers.
Results
Records spanned 50+ distinct job roles across 15 primary units (Foundry, Melting Shop, Heavy Machinery, Transport, Refractory, Maintenance, HSE, Administration, etc.).
Frequency of measured environmental hazards: Dust and Silica (22%), Noise (24%), Chemical heavy metals (Mn, Cd, Cr, Pb, Fe, Zn) (21%), Ergonomics (10%), Light and IR Radiation (infrared and ultraviolet) (18%), thermal stress, and whole-body vibration (WBV) (5%). Other hazards (UV, Vibration, Lighting, Magnetic Fields, Oil Mist) comprised <1% (Table 1).
Table 1 outlines the descriptive characteristics of the research samples included min, max, mean ( , standard deviation (SD), skewness, and kurtosis in the research factors. Table 2 presents C.I and P-Value of one sample T test. As detailed in Table 2, the statistical comparison of mean exposures against standard limits was primarily undertaken using the independent sample t-test. However, preliminary assumption checks (skewness and kurtosis) indicated that the distribution of ESR for certain specific chemical agents, such as Lead (Pb), significantly deviated from normality. Hence, to maintain statistical rigor, the non-parametric Median test was applied for these specific variables (denoted by * in Table 2) as a robust alternative to evaluate their central tendencies. Based on Table 2, the results of statistic tests demonstrated that there was a significant difference in the heavy metals level such as Cadmium (Cd), Chromium (Cr), Iron (Fe) and Lead (Pb) of the chemical factors respect to the permissible exposure limit (P<0.001). Nevertheless, manganese (P=0.180), Free Silica (P=0.504) as the heavy metals as well as Dust (P=0.834) have been within the range of permissible exposure limit. In the physical factors, Light and infrared (P<0.001), besides Noise (P=0.007) have a
significant difference with the permissible exposure limit. Nevertheless, the ultraviolet (P=0.262) and WBV (P=0.195) are in the range of permissible exposure limit. Eventually, the ergonomic and psychological factors have a significant difference with respect to permissible exposure limit (P<0.001).
Table 2. T-test and C.I for Measured exposure and ESR variables
| Variable | Factor | Confidence Interval (95%) | P-Value | |
| Measured exposure | ESR | |||
| Chemical | Cd | 0.0055 ± 0.0009 | 0.8265 ± 0.04966 | <0.001 |
| Cr | 0.2756 ± 0.0448 | 0.5511 ± 0.08962 | <0.001 | |
| Fe | 2.99 ± 0.37 | 0.5989 ± 0.07473 | <0.001 | |
| Mn | 0.160 ± 0.044 | 1.6030 ± 0.43735 | 0.180 | |
| Pb | 0.0276 ± 0.0043 | 0.5520 ± 0.08729 | 0.006* | |
| Dust | 3.032 ± 0.348 | 1.0106 ± 0.44950 | 0.814 | |
| Free Silica | 0.0225 ± 0.0036 | 0.8982 ± 0.14676 | 0.504 | |
| Physical | WBV | 0.766 ± 0.077 | 0.8805 ± 0.08904 | 0.195 |
| Light | 703.56 ± 79.983 | 2.3862 ± 0.25733 | <0.001 | |
| Noise | 82.93± 0.752 | 0.9570 ± 0.01070 | 0.007 | |
| Infrared | 3.906 ± 0.891 | 0.3906 ± 0.08915 | <0.001 | |
| Ultraviolet | 0.705 ± 0.258 | 0.7054 ± 0.25833 | 0.262* | |
| Ergonomic | - | 4.478 ± 0.133 | 2.2289 ± 0.06798 | <0.001 |
| Psychologic | Thermal Stress | 32.35 ± 0.929 | 1.1534 ± 0.03414 | <0.001 |
*P-Value of Median Test: A Nonparametric Alternative to the t-Test
The results of ANOVA test indicated a statistically significant difference among the groups, F(13, 634) = 24.309, p < 0.001. Table 3 reports Scheffé's post hoc test of the pairwise comparisons groups. This table also outlines the results of the Scheffe post-hoc analysis following the ANOVA test. The variables are categorized into distinct homogeneous subsets. Notably, the significance levels (Sig.) within each subset are strictly greater than 0.05 (e.g., P = 0.482 for Subset 1, and P = 0.069 for Subset 2). In the context of a post-hoc analysis, this lack of statistical significance within a subset implies that the exposure levels of the hazards grouped together (e.g., Infrared, Cr, Pb, and Fe in Subset 1) are statistically homogeneous and do not differ significantly from one another. This enables clustering specific chemical and physical hazards into uniform risk tiers, prioritizing interventions for higher-tier subsets (e.g., Subset 4 containing Ergonomic and Light hazards).
Table 3. Output of Scheffe Post-Hoc ANOVA Test for ESR Variable
| Exposure | N | Subset for alpha = 0.05 | |||
| 1 | 2 | 3 | 4 | ||
| Infrared | 45 | .3906 | |||
| Cr | 27 | .5511 | .5511 | ||
| Pb | 27 | .5520 | .5520 | ||
| Fe | 27 | .5989 | .5989 | ||
| Ultraviolet | 38 | .7054 | .7054 | ||
| Cd | 62 | .8265 | .8265 | ||
| WBV | 20 | .8805 | .8805 | ||
| Free Silica | 11 | .8982 | .8982 | ||
| Noise | 118 | .9570 | .9570 | ||
| Dust | 130 | 1.0106 | 1.0106 | ||
| Thermal Stress | 16 | 1.1534 | 1.1534 | 1.1534 | |
| Mn | 27 | 1.6030 | 1.6030 | 1.6030 | |
| Ergonomic | 67 | 2.2289 | 2.2289 | ||
| Light | 32 | 2.3862 | |||
| Sig. | .482 | .069 | .052 | .560 |
The CHAID decision tree analysis (α=0.05) identified significant predictors of occupational exposure ratios (measured exposure / regulatory limit) in a cohort of 647 observations. The overall model was statistically significant (F=199.952, df=3,417, P<0.001), explaining substantial variance in exposure levels (Fig. 1).
Fig. 1. CHAID Output Classified diagram of ESR Variable
The mean exposure ratio across all observations was 1.083 (SD=0.965), revealing a slight exceedance (8%) of regulatory limits. This suggests that, on aggregate, measured exposures were so marginally higher than established safety thresholds.
Risk Stratification (Exposure Split): The most significant partition divided the cohort based on exposure to specific hazard combinations:
Compliant Group: Exposure to the heavy metals risk factors included Pb, Fe, Cr, as well as the physical risk factors: Ultraviolet Radiation including infrared and ultraviolet, was linked to the lowest exposure ratio. Comprising 61% of the workforce (n=396), this group demonstrated the best compliance, with a mean ratio of 0.551 ± 0.881 (Mean ± SD). Rather than definitively proving the efficacy of specific engineering controls—which cannot be established solely through cross-sectional data—this low exposure level demonstrates a favorable current state within this subset (Node 2, Fig. 1). This state may be associated with existing workplace interventions or the appropriate usage of personal protective equipment (PPE), though longitudinal studies are essential to confirm causality.
Subthreshold -Compliance Group: Exposure to the heavy metals risk factors including Free Silica and Cd, beside WBV, was tied to the Subthreshold -Compliance exposure ratio. Node 1 comprised 175 participants (27% of the total sample). This group showed moderate compliance, with a mean exposure-to-regulatory-limit ratio of 0.847 ± 0.401, indicating that exposures were partly below the regulatory limits (Fig. 1).
Threshold-Level Group: The analysis identified several factors operating at the threshold of permissible exposure limits:
Dust and Noise exposures exhibited a ratio of 0.995 ± 0.380 (Mean ± SD). While these exposure levels currently remain within regulatory compliance (ratio ≤1), their proximity to the threshold warrants careful consideration (Node 4, Fig. 1).
Elevated-Risk: Exposure to Mn and thermal stress was linked to the high-risk exposure ratio. This group demonstrated a moderate risk, with a mean ratio of 1.436± 1.803, signifying exposures greater than regulatory limits (Node 3, Fig. 1).
Highest-Risk Group: The combination of light and ergonomic factors led to the highest exposure ratio above the regulatory limit. This highlights the need for targeted interventions in such scenarios (Node 5, Fig. 1).
Comparative Analysis of Statistical and Data Mining Approaches: While classical statistical tests and the CHAID algorithm were applied to the same occupational health dataset, they yielded complementary insights rather than conflicting outputs. A structured comparison of their results well indicates how the two methodologies validate and augment one another:
Convergence and Validation of Findings: The findings from both methodologies strongly corroborated one another regarding identification of high-risk exposures. The classical ANOVA with Scheffe's post-hoc analysis (Table 3) isolated 'Light' (Mean ESR = 2.38) and 'Ergonomic' hazards (Mean ESR = 2.22) as the most severe individual risk factors, clustering them in the highest-risk subset (Subset 4). Correspondingly, the CHAID decision tree validated this statistical finding through populating its 'Non-Compliant/High-Risk' terminal nodes with observations primarily driven by these specific physical and ergonomic extremes. This structural agreement proves that both models precisely converge on identifying the primary sources of occupational risk.
Complementary Perspectives (Variable-Centric vs. Population-Centric): In spite of their convergence, the two approaches provided fundamentally different, yet complementary, practical perspectives. Classical approaches (T-test and ANOVA) excelled in a variable-centric analysis; they rigorously ascertained the isolated severity of each hazard against occupational limits (Table 2) and established strict confidence intervals. Nevertheless, classical tests failed to capture the workforce distribution across these risks. Conversely, the CHAID model contributed a population-centric perspective. Instead of merely ranking hazard severity, the data mining approach dynamically segmented the workforce. It demonstrated the actionable insight that despite the presence of statistically severe hazards, 61% of the observed workforce safely fell into the 'Compliant' zone, while 27% lingered in a vulnerable 'Subthreshold' zone.
Methodological Advantages in Hazard Assessment: Further, whereas ANOVA inherently assumed independent group means and linear comparisons, CHAID successfully navigated the dataset without requiring rigid parametric assumptions. This is particularly crucial since assumption checks entailed non-parametric alternatives (Median tests) for highly skewed variables such as Lead (Pb) and Noise. CHAID inherently bypassed these distributional limitations, mapping out exact, data-driven cutoff points for exposure severity.
Discussion
In synthesis, classical statistics identified exactly what the most critical hazards were and to what extent they deviated from standard limits. On the other hand, the CHAID data mining approach visualized who was affected, how the workforce was stratified, and where safety interventions should be strategically prioritized by HSE management.
The findings demonstrated a critical dichotomy in the safety profile of the Chadormalu industrial complex. While chemical hazards such as Fe, Cr, and Pb were generally well-controlled, possibly reflecting the efficacy of established engineering controls and ventilation systems for specific agents [7-9], physical and ergonomic stressors emerged as severe, persistent challenges [1,18]. The mechanistic reasons behind these patterns are deeply rooted in the operational realities of the site. The severe exceedance ratios (ESR>2.0) noted for Light/Infrared (IR) radiation are a direct consequence of the workforce’s proximity to melting shops, furnaces, as well as continuous thermal operations, where radiant heat and intense light are inescapable byproducts. Likewise, the pronounced ergonomic deviations are intrinsic to the heavy industrial context; tasks demanding the operation of heavy machinery, manual material handling of massive components, and the sustained awkward, static postures frequently assumed by maintenance crews drive these extreme ergonomic challenges.
These observations largely align with recent epidemiological examinations in the mining and steel manufacturing sectors. Contemporary studies, including Golmohammadi and Darvishi [1] and studies on mining ergonomics [18] have reported that while chemical airborne exposures in modernized steelworks are increasingly mitigated [7-9], physical and ergonomic burdens remain disproportionately high [1,18]. Nevertheless, the methodological novelty of our research lies in moving beyond the limitations of these prior studies [1,6,18]. Whereas previous literature has predominantly ascertained occupational hazards in isolation [7-9,18], our application of the CHAID algorithm illuminates the interactive and synergistic effects of combined stressors that conventional single-agent monitoring often fails to capture [1,6]. This accords with the limitations of classical T-tests used in our initial analysis, which confirmed significant violations (p<0.05) across the board but missed the critical nuance of compounding vulnerabilities [1,6].
Therefore, do not interpret CHAID terminal nodes merely as average exposure values. Each node represents a distinct subgroup of workers with a specific combination of hazard types, job roles, and exposure severity. These combinations form multidimensional risk profiles that help HSE managers prioritize targeted interventions.
The algorithm successfully mapped the complex, non-linear interactions between distinct hazard clusters and job categories. Operationally, these terminal nodes serve as diagnostic tools that pinpoint critical organizational “hot-spots.” This empowers HSE management to transition from generic, plant-wide safety protocols, which often result in an inefficient, equal distribution of safety budgets, to highly targeted, cost-effective interventions. Through strategically prioritizing localized engineering controls and customized interventions specifically for the high-risk intersections identified by CHAID (e.g., specific job roles facing concurrent noise and ergonomic strain), the complex can address the urgent gap between theoretical protection (based on PPE issuance) and actual exposure levels.
In spite of the robust methodological framework and the novel application of the CHAID decision tree algorithm, this study has been subject to several limitations that warrant acknowledgment. First, the research employed a cross-sectional design, which inherently restricts the ability to establish causal relationships or monitor the cumulative, longitudinal health impacts of multi-hazard exposures over time. Further, the dataset was exclusively derived from a single, albeit massive, steel manufacturing and mining complex in Iran. Hence, the external validity and generalizability of the findings to other industrial sectors or geographic regions—which may operate under different occupational health regulations or climatic conditions—should be approached with caution.
Also, occupational exposure measurements, especially for dynamic environmental factors such as thermal stress and lighting, represent temporal snapshots. These variables are highly susceptible to seasonal and diurnal variations that may not be fully captured in a single cross-sectional measurement phase. Ultimately, while we rigorously standardized all hazard types into a unified dimensionless index (ESR), the primary data collection for ergonomic and psychosocial factors relied on semi-quantitative observational tools. These methods inherently carry a degree of subjectivity compared to the precision of direct-reading instruments utilized for physical and chemical agents.
Future research endeavors should prioritize longitudinal cohort designs to capture temporal exposure dynamics and incorporate seasonal variations. Further, applying advanced ensemble machine learning techniques, such as Random Forests or Gradient Boosting, could build upon the foundational non-linear interactions identified by the CHAID model in this study, thereby enhancing the predictive accuracy of occupational risk profiling. Future research should incorporate longitudinal exposure monitoring for validating the causal links suggested by this cross-sectional analysis. Also, incorporating cost-benefit analyses of advanced engineering controls could provide the financial justification required to bridge the gap between risk identification and mitigation.
Conclusion
This study successfully indicated that integrating classical statistical methods with the CHAID data mining algorithm provides a more robust framework for occupational risk assessment than either method alone. While classical statistics (T-test/ANOVA) rigorously quantified the severity of hazards—identifying light and ergonomic factors as the most critical violations—the CHAID model effectively stratified the workforce, uncovering that 61% of personnel operate within compliant zones in spite of high average risk levels in specific pockets. The results dictate a necessary paradigm shift for HSE management: moving from broad-spectrum monitoring to targeted interventions. Immediate priority should be given to higher-level controls (Elimination and Engineering) for noise and ergonomic hazards, as reliance on PPE has proven insufficient for high-risk subgroups.
Acknowledgments
The authors would like to express their sincere gratitude to the HSE management and staff of Chadormalu Steel Factory for their cooperation and for providing the anonymized HSE dataset used in this study. The authors also thank the Department of Statistics, Payame Noor University, for technical support.
Conflict of interest
None declared.
Funding
This research did not receive any specific grant from funding agencies in the public, commercial, or not-for-profit sectors.
Ethical Considerations
Strict protocols were implemented to safeguard the privacy and confidentiality of the personnel whose data were utilized in this study. Prior to data extraction and analysis, the facility's central HSE department completely anonymized the dataset. All direct personal identifiers—including names, employee identification numbers, and contact information—were removed. The research team was exclusively provided with a de-identified dataset categorized solely by operational departments and hazard exposure metrics. Further, all findings in this study are reported in an aggregated format, ensuring that no individual worker's health or exposure status can be traced or inferred from the published results.
Code of Ethics
This cross-sectional study used only routinely collected, de-identified occupational exposure data. No human participants were directly involved, and no personal identifiers were accessible to the research team. The study was therefore exempt from formal ethical approval according to the institutional ethics policy; nevertheless, all data handling procedures complied with national research ethics regulations.
Authors' Contributions
Alireza Pakgohar: Conceptualization, Methodology, Formal analysis, Data curation, Writing – original draft, Writing – review & editing, Supervision; Reza Moradeskandari: Conceptualization, Investigation, Resources, Data curation.
References
1. Golmohammadi R, Darvishi E. The combined effects of occupational exposure to noise and other risk factors - a systematic review. Noise Health. 2019;21(101):125-41. [DOI] [PMID] [PMCID]
2. Estill CF, Rice CH, Morata T, Bhattacharya A. Noise and neurotoxic chemical exposure relationship to workplace traumatic injuries: a review. J Safety Res. 2017;60:35-42. [DOI] [PMID] [PMCID]
3. World Health Organization. Occupational hazards in the health sector Geneva, Switzerland: World Health Organization; 2025. [URL]
4. Rabiei H, Ramezanifar S, Hassanipour S, Gharari N. Investigating the effects of occupational and environmental noise on cardiovascular diseases: a systematic review and meta-analysis. Environ Sci Pollut Res Int. 2021;28(44):62012-29. [DOI] [PMID]
5. Yadav OP, Sarkar A, Shan D, Rahman A, Moro L. Occupational noise exposure and health impacts among fish harvesters: a systematic review. Int Marit Health. 2021;72(3):199-205. [DOI] [PMID]
6. Issah I, Duah MS, Arko-Mensah J, Bawua SA, Agyekum TP, Fobil JN. Exposure to metal mixtures and adverse pregnancy and birth outcomes: a systematic review. Sci Total Environ. 2024;908:168380. [DOI] [PMID]
9. Swedish Council on Health Technology Assessment. Occupational health and safety -- chemical exposure: a systematic review and assessment of the social, medical and ethical aspects [Internet]. Stockholm: Swedish Council on Health Technology Assessment (SBU); 2017. SBU Assessment No. 261: 28876751 [Bookshelf ID] [PMID]
10. Davidson M, Reed S, Oosthuizen J, O'Donnell G, Gaur P, Cross M, et al. Occupational health and safety in cannabis production: an Australian perspective. Int J Occup Environ Health. 2018;24(3-4):75-85. [DOI] [PMID] [PMCID]
11. Tolera ST, Temesgen S, Endalew SM, Alamirew TS, Temesgen LM. Global systematic review of occupational health and safety outcomes among sanitation and hygiene workers. Front Public Health. 2023;11:1304977. [DOI] [PMID] [PMCID]
12. Sepadi MM, Nkosi V. Environmental and occupational health exposures and outcomes of informal street food vendors in South Africa: a quasi-systematic review. Int J Environ Res Public Health. 2022;19(3):1348. [DOI] [PMID] [PMCID]
13. Mucci N, Tommasi E, Chiarelli A, Lulli LG, Traversini V, Galea RP, et al. WORKbiota: a systematic review about the effects of occupational exposure on microbiota and workers' health. Int J Environ Res Public Health. 2022;19(3):1043. [DOI] [PMID] [PMCID]
14. Che Huei L, Ya-Wen L, Chiu Ming Y, Li Chen H, Jong Yi W, Ming Hung L. Occupational health and safety hazards faced by healthcare professionals in Taiwan: a systematic review of risk factors and control strategies. SAGE Open Med. 2020;8:2050312120918999. [DOI] [PMID] [PMCID]
15. Wysong K, Phillips JA, Hammond S. Hypersensitivity pneumonitis. Workplace Health Saf. 2016;64(6):284. [DOI] [PMID]
16. Hammond S, Phillips JA. Carbon monoxide poisoning. Workplace Health Saf. 2019;67(2):98-100. [DOI] [PMID]
17. Boybeyi-Turer O, Celik HT, Arslan UE, Soyer T, Tanyel FC, Kiran S. Environmental exposure in the etiology of infantile hypertrophic pyloric stenosis: a systematic review and meta-analysis. Pediatr Surg Int. 2022;38(7):951-61. [DOI] [PMID]
19. Pakgohar A. An examination of causes and effective factors on reducing traffic accidents, based on CART and LR regression. sl: Applied Research Office. Guidance and Driving Police; 2007.
20. Pakgohar A, Saffarzadeh M, Khalili M. The survey role of humanistic factor in incidence and intensity of road accident based on Logistic Regression and CART. Tehran: Applied Research Office of Traffic Police. 2008;13(5):49-66.
21. Pakgohar A, Khalili M, Saffarzadeh M. Road traffic accident reduction via GLM, CRT, LR regression models. J Res Police Sci. 2010;12(1(46)):77-106.
Send email to the article author
| Rights and permissions | |
 |
This work is licensed under a Creative Commons Attribution 4.0 International License. |