Journal of Occupational
Health and Epidemiology

Rafsanjan university Of medical sciences
Volume 15, Issue 2 (Spring 2026)
J Occup Health Epidemiol 2026, 15(2): 101-108 |
Back to browse issues page




Download citation:
BibTeX | RIS | EndNote | Medlars | ProCite | Reference Manager | RefWorks
Send citation to:


BibTeX | RIS | EndNote | Medlars | ProCite | Reference Manager | RefWorks
Send citation to:
Hashim S A, Ibrahim A H, Abdulateef A M. Prevalence of Overweight and Obesity among Students at Southern Technical University in Basrah, Iraq; A Cross-Sectional Study (2024-25). , J Occup Health Epidemiol. 2026; 15 (2) :101-108
URL: http://johe.rums.ac.ir/article-1-1170-en.html
URL: http://johe.rums.ac.ir/article-1-1170-en.html
Related article in
Google Scholar
Google Scholar
Similar articles


1- Associated Prof., Dept. of Community Health, Technical Medical Institute, Southern Technical University, Basrah, 61001, Iraq. , saman.hashim@stu.edu.iq
2- Associated Prof., Dept. of Community Health, Technical Medical Institute, Southern Technical University, Basrah, 61001, Iraq.
2- Associated Prof., Dept. of Community Health, Technical Medical Institute, Southern Technical University, Basrah, 61001, Iraq.
Article history

Received: 2026/02/19
Accepted: 2026/05/3
ePublished: 2026/06/30
Accepted: 2026/05/3
ePublished: 2026/06/30
Subject:
Epidemiology
Keywords: Overweight [MeSH], Obesity [MeSH], Students [MeSH], University [MeSH], Body Mass Index [MeSH], Iraq [MeSH]
Full-Text [PDF 357 kb]
(197 Downloads)
| Abstract (HTML) (526 Views)
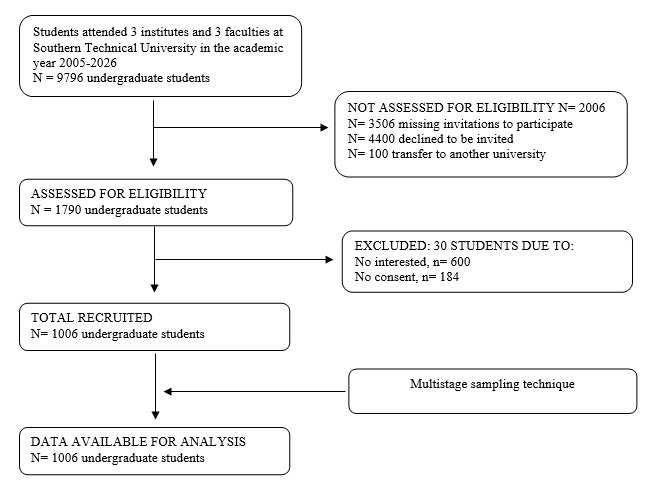
Fig. 1. STROBE-style flow chart of the students' enrollment
Table 1. Distribution of Socio-Demographic Characteristics by BMI Category among Students at Southern Technical University (n=1006)
Table 2. Predictions of Obesity in Relation to Socio-demographic Factors (n= 1006)
Full-Text: (46 Views)
Introduction
The global rise in overweight and obesity rates poses a significant public health challenge. The World Health Organization classifies these conditions as major risk factors for diseases such as diabetes, cardiovascular disease, and some cancers ADDIN EN.CITE.DATA [1]. While overweight and obesity were previously concentrated in high-income countries, they are now growing in low- and middle-income countries, driven by dietary changes, urbanization, and evolving lifestyles [2]. The Eastern Mediterranean region, particularly Iraq, has witnessed a significant rise in obesity rates in recent years [3, 4].
University students represent a crucial demographic in the context of rising obesity rates. This age group is characterized by significant changes in dietary habits, physical activity, sleep patterns, and stress management, all of which can contribute to excessive weight gain [5]. Research in similar settings suggests that many university students engage in obesity-related behaviors, including overconsumption of high-calorie foods, prolonged inactivity owing to academic pressures, and a lack of regular exercise [6]. The consequences of obesity extend beyond physical health; strong evidence links it to diminished academic performance, reduced quality of life, and elevated stress levels [7].
In spite of the seriousness of this issue, data on the prevalence of overweight and obesity, nutrition, and health status among young people in Iraq remain limited [8]. National surveys often overlook individuals aged 18–24, particularly within the unique context of university life [9]. Basrah, a prominent educational centre in Iraq, presents an important setting owing to its climate, local dietary patterns, and economic challenges exacerbated by recent instability, all impacting student health. Thus, it is essential to conduct a study of university students in Basrah to determine the prevalence of overweight and obesity for developing effective public health plans. This study was undertaken in Basra, Iraq. Specifically, it targeted students at Southern Technical University, not for convenience, but because this location represents an important and understudied group considering risk factors for complex patterns of obesity.
The results of this study can provide valuable insights for university administrations and health authorities in Basrah, enabling the development of targeted interventions such as nutrition education, improved opportunities for physical activity, and supportive university environments. These measures could lower students' risk of obesity and promote their long-term health. For these reasons, this research aims to determine the prevalence of overweight and obesity, together with related social and demographic factors, among students at Southern Technical University in Basrah, Iraq, thereby addressing a significant gap in public health knowledge at the regional level.
Materials and Methods
This research utilized a cross-sectional design to determine the point prevalence of overweight and obesity among students at Southern Technical University (STU) in Basrah, Iraq, as well as to explore the association between socio-demographic factors and anthropometric measurements in compliance with the Strengthening the Reporting of Observational Studies in Epidemiology (STROBE) guidelines for cross-sectional studies.
The study was undertaken at STU in Basrah, which includes 3 colleges (medical technology, engineering technology, and administrative tech231nology) plus 3 institutes (medical, technological, and administrative). STU offers education leading to both diplomas and bachelor's degrees in Southern Iraq, including Basrah, Maisan, and Thi-Qar governorates. Data collection took place over six months (October 2024 to March 2025).
The primary outcome variable was continuous body mass index (BMI), while independent variables included socio-demographic and academic factors. Students enrolled in the 2025/2026 academic year who were present along the data collection period were included. Selected students were contacted in their departments or lecture halls. The study's purpose, procedures, risks, and benefits were clearly explained. Research assistants were available to clarify any questions pertained to the questionnaire, but they did not influence participants' responses. Each interview lasted approximately 10 minutes.
The study targeted full-time undergraduate students. In order to ensure proportionate representation from the various colleges, institutes, and departments at STU in Basrah, a stratified sampling method was applied. In the first stage, all three colleges and three institutes were selected, followed by the random selection of three departments from each. In the second stage, four classes were randomly selected from each department. Eventually, approximately 15 students were randomly selected from each class list to participate. The total number of undergraduate students at STU in Basrah for the 2024-2025 academic year was 9,796. Using an online sample size calculator, with a 95% confidence level, a 5% margin of error, and an estimated obesity prevalence of 30% [10], the minimum required sample size was determined to be 800 participants. To account for the possibility of non-response, we sought to recruit an additional 20% of participants, leading to a final sample size of 1,006 students. Eligibility criteria included undergraduate enrollment, age between 18 and 30 years, and informed consent. Exclusion criteria included age 31 years or older and refusal to participate. Fig. 1 depicts a flowchart of the participant recruitment process.
Data were collected using interview questions. The questions were about age, sex, and institute/college, while the anthropometric measurements were taken directly by the researchers. The researchers measured the weight to the nearest 0.1 kg using a calibrated digital weighing scale (SECA; British Indicators, London, U.K.), with participants lightly dressed and barefoot; calibration was checked periodically. The researchers measured the height to the nearest 0.1 cm using a portable height scale (SECA; British Indicators, London, U.K.), with participants standing upright and barefoot. The height and weight were measured once for each participant using standardized protocols and calibrated equipment. BMI was calculated through dividing weight in kilograms by the square of height in meters (kg/m²). The participants were classified according to World Health Organization [11] criteria (underweight: BMI < 18.5, normal weight: BMI 18.5–24.9, overweight: BMI 25.0–29.9, and obese: BMI ≥ 30.0). Informed consent was obtained prior to the interview. There were no missing data, as all data were collected directly.
The methods employed several strategies to minimize bias: First, selection bias was addressed through stratified random sampling and simple random selection within each stratum using a random number generator.
The global rise in overweight and obesity rates poses a significant public health challenge. The World Health Organization classifies these conditions as major risk factors for diseases such as diabetes, cardiovascular disease, and some cancers ADDIN EN.CITE.DATA [1]. While overweight and obesity were previously concentrated in high-income countries, they are now growing in low- and middle-income countries, driven by dietary changes, urbanization, and evolving lifestyles [2]. The Eastern Mediterranean region, particularly Iraq, has witnessed a significant rise in obesity rates in recent years [3, 4].
University students represent a crucial demographic in the context of rising obesity rates. This age group is characterized by significant changes in dietary habits, physical activity, sleep patterns, and stress management, all of which can contribute to excessive weight gain [5]. Research in similar settings suggests that many university students engage in obesity-related behaviors, including overconsumption of high-calorie foods, prolonged inactivity owing to academic pressures, and a lack of regular exercise [6]. The consequences of obesity extend beyond physical health; strong evidence links it to diminished academic performance, reduced quality of life, and elevated stress levels [7].
In spite of the seriousness of this issue, data on the prevalence of overweight and obesity, nutrition, and health status among young people in Iraq remain limited [8]. National surveys often overlook individuals aged 18–24, particularly within the unique context of university life [9]. Basrah, a prominent educational centre in Iraq, presents an important setting owing to its climate, local dietary patterns, and economic challenges exacerbated by recent instability, all impacting student health. Thus, it is essential to conduct a study of university students in Basrah to determine the prevalence of overweight and obesity for developing effective public health plans. This study was undertaken in Basra, Iraq. Specifically, it targeted students at Southern Technical University, not for convenience, but because this location represents an important and understudied group considering risk factors for complex patterns of obesity.
The results of this study can provide valuable insights for university administrations and health authorities in Basrah, enabling the development of targeted interventions such as nutrition education, improved opportunities for physical activity, and supportive university environments. These measures could lower students' risk of obesity and promote their long-term health. For these reasons, this research aims to determine the prevalence of overweight and obesity, together with related social and demographic factors, among students at Southern Technical University in Basrah, Iraq, thereby addressing a significant gap in public health knowledge at the regional level.
Materials and Methods
This research utilized a cross-sectional design to determine the point prevalence of overweight and obesity among students at Southern Technical University (STU) in Basrah, Iraq, as well as to explore the association between socio-demographic factors and anthropometric measurements in compliance with the Strengthening the Reporting of Observational Studies in Epidemiology (STROBE) guidelines for cross-sectional studies.
The study was undertaken at STU in Basrah, which includes 3 colleges (medical technology, engineering technology, and administrative tech231nology) plus 3 institutes (medical, technological, and administrative). STU offers education leading to both diplomas and bachelor's degrees in Southern Iraq, including Basrah, Maisan, and Thi-Qar governorates. Data collection took place over six months (October 2024 to March 2025).
The primary outcome variable was continuous body mass index (BMI), while independent variables included socio-demographic and academic factors. Students enrolled in the 2025/2026 academic year who were present along the data collection period were included. Selected students were contacted in their departments or lecture halls. The study's purpose, procedures, risks, and benefits were clearly explained. Research assistants were available to clarify any questions pertained to the questionnaire, but they did not influence participants' responses. Each interview lasted approximately 10 minutes.
The study targeted full-time undergraduate students. In order to ensure proportionate representation from the various colleges, institutes, and departments at STU in Basrah, a stratified sampling method was applied. In the first stage, all three colleges and three institutes were selected, followed by the random selection of three departments from each. In the second stage, four classes were randomly selected from each department. Eventually, approximately 15 students were randomly selected from each class list to participate. The total number of undergraduate students at STU in Basrah for the 2024-2025 academic year was 9,796. Using an online sample size calculator, with a 95% confidence level, a 5% margin of error, and an estimated obesity prevalence of 30% [10], the minimum required sample size was determined to be 800 participants. To account for the possibility of non-response, we sought to recruit an additional 20% of participants, leading to a final sample size of 1,006 students. Eligibility criteria included undergraduate enrollment, age between 18 and 30 years, and informed consent. Exclusion criteria included age 31 years or older and refusal to participate. Fig. 1 depicts a flowchart of the participant recruitment process.
Data were collected using interview questions. The questions were about age, sex, and institute/college, while the anthropometric measurements were taken directly by the researchers. The researchers measured the weight to the nearest 0.1 kg using a calibrated digital weighing scale (SECA; British Indicators, London, U.K.), with participants lightly dressed and barefoot; calibration was checked periodically. The researchers measured the height to the nearest 0.1 cm using a portable height scale (SECA; British Indicators, London, U.K.), with participants standing upright and barefoot. The height and weight were measured once for each participant using standardized protocols and calibrated equipment. BMI was calculated through dividing weight in kilograms by the square of height in meters (kg/m²). The participants were classified according to World Health Organization [11] criteria (underweight: BMI < 18.5, normal weight: BMI 18.5–24.9, overweight: BMI 25.0–29.9, and obese: BMI ≥ 30.0). Informed consent was obtained prior to the interview. There were no missing data, as all data were collected directly.
The methods employed several strategies to minimize bias: First, selection bias was addressed through stratified random sampling and simple random selection within each stratum using a random number generator.
Fig. 1. STROBE-style flow chart of the students' enrollment
Table 1. Distribution of Socio-Demographic Characteristics by BMI Category among Students at Southern Technical University (n=1006)
| Variables | Categories | Total N (%) |
BMI Categories, n (% Within BMI Category) | P-Value | |||
| Under Weight 7.2% (n=72) |
Normal Weight 65.4% (n=658) |
Overweight 19.1% (n=192) |
Obesity 8.4% (n=84) |
||||
| Sex | Male | 394 (39.2) | 28 (2.8) | 274 (27.2) | 66 (6.6) | 26 (2.6) | 0.117 |
| Female | 612 (60.8) | 44 (4.4) | 384 (38.2) | 126 (12.5) | 58 (5.8) | ||
| Age Group | 18-20 years old | 424 (42.1) | 44 (4.4) | 278 (27.6) | 72 (7.2) | 30 (3.0) | 0.007 |
| 21-23 years old | 386 (38.4) | 16 (1.6) | 258 (25.6) | 80 (8.0) | 32 (3.2) | ||
| 24-26 years old | 120 (11.9) | 10 (1.0) | 78 (7.8) | 22 (2.2) | 10 (1.0) | ||
| 27-30 years old | 76 (7.6) | 2 (0.2) | 44 (4.4) | 18 (1.8) | 12 (1.2) | ||
| Faculties & Institutes |
Medical Institute | 177 (17.6) | 12 (1.2) | 117 (11.6) | 30 (3.0) | 18 (1.8) | 0.243 |
| Technological Institute | 151 (15.1) | 11 (1.1) | 98 (9.7) | 33 (3.3) | 9 (9.0) | ||
| Administrative Institute | 170 (16.9) | 9 (0.9) | 98 (9.7) | 45 (4.5) | 18 (1.8) | ||
| College of Medical Technology | 178 (17.7) | 18 (1.8) | 116 (11.5) | 30 (3.0) | 14 (1.4) | ||
| College of Engineering Technology | 162 (16.1) | 12 (1.2) | 116 (11.5) | 25 (2.5) | 9 (0.9) | ||
| College of Administrative Technology | 168 (16.7) | 10 (1.0) | 113 (11.2) | 29 (2.9) | 16 (1.6) | ||
Note: N = total population, n = subgroup population, % = percent, BMI = body mass index, p = probability. Percentages represent the proportion of students in each BMI category within each demographic subgroup (gender, age group, college/institution). The statistical test used is Chi-square or Fisher's exact test for small expected cell frequencies. The p-value is statistically significant at p≤0.05.
Further, measurement bias was controlled through standardized body measurement procedures (trained assistants, calibrated equipment). Also, non-response bias was proactively managed through adding a 20% safety margin to the sample size to account for potential withdrawals. Finally, confounding-variable bias was addressed during the analysis phase using stepwise multiple regression, which controls for multiple independent variables simultaneously.
Further, measurement bias was controlled through standardized body measurement procedures (trained assistants, calibrated equipment). Also, non-response bias was proactively managed through adding a 20% safety margin to the sample size to account for potential withdrawals. Finally, confounding-variable bias was addressed during the analysis phase using stepwise multiple regression, which controls for multiple independent variables simultaneously.
The data were coded and entered into SPSS version 25.0 (IBM) for analysis and to impute missing data. The Kolmogorov-Smirnov test confirmed normal distribution. Data were described using frequencies and percentages for categorical variables, with means and standard deviations applied for continuous variables. The main outcome variable was the continuous BMI, so an independent t-test was utilized for two categorical variables. In contrast, one-way analysis of variance (ANOVA) was used for variables with three or more categories. Bonferroni's correction and Tukey's test were employed to check for statistically significant differences in ANOVA when p ≤ 0.05. Variables with p-values < 0.25 from Table 1 were entered into the regression model. Categorical variables were treated as dummy variables. Non-standardized coefficients (B) represent the mean difference in BMI between each category and its reference group, while holding all other variables constant. The adjusted coefficient of determination (R²) and its 95% confidence intervals have been reported. The final model was selected using stepwise p-value-based regression, with variables entered at p ≤ 0.05 and output at p > 0.05.
Results
This study included 1006 undergraduate students (394 males, 39.2%; and 612 females, 60.8%) with a mean age of 21.7 ± 2.7 years. To account for the possibility of non-response, an additional 20% of participants were recruited, augmenting the final sample size to 1006 students. Fig. 1 displays the participant recruitment process. The sample was distributed by age group as follows: 424 (42.1%) were aged 18–20 years, and 386
(38.4%) were aged 21–23 years, with these two groups constituting the majority. The participants were selected from six academic units: the Medical Institute (17.6%), the Technological Institute (15.0%), the Administrative Institute (16.9%), the College of Medical Technology (17.7%), the College of Engineering Technology (16.1%), and the College of Administrative Technology (16.7%). Based on Body Mass Index (BMI) classifications, the prevalence of overweight and obesity among the students was as follows: overweight, 19.1% (n = 192); and obesity, 8.4% (n = 84). Hence, the overall prevalence of overweight and obesity was 27.5%. Statistical analysis revealed no statistically significant association between sex and BMI categories (p = 0.117, 95% CI = 0.093-0.132). Even though females comprised a larger proportion of the sample, their distribution across BMI categories did not differ significantly from that of males. Nevertheless, Statistical analysis presented a significant correlation between age group and BMI category (p=0.007, 95% CI = 0.002-0.013), with higher rates of overweight and obesity observed in older age groups (21-23 years and 27-30 years) than in younger students (Table 1).
A stepwise multiple linear regression model was constructed to identify independent predictors of BMI, as outlined in Table 2. Variables with p-values < 0.25 from binary analyses were included in the initial model, and non-significant variables (p > 0.05) were then excluded using stepwise exclusion. Multiple linear correlation tests confirmed that all variance inflation (VIF) coefficients were < 10, reflecting no significant multicollinearity among predictors. The final regression model identified nine independent predictors for BMI, together explaining approximately 4% of the variance in BMI (adjusted R² = 0.037, F [2,1004] = 26.724, p < 0.001). Age emerged as the strongest predictor (β = 0.173, B = 0.251, p < 0.001), followed by female gender (β = 0.116, B = 0.931, p < 0.001), which was also a significant predictor. Table 2 reported the unstandardized (B) and standardized (β) regression coefficients for each predictor in the regression model (Table 2).
Results
This study included 1006 undergraduate students (394 males, 39.2%; and 612 females, 60.8%) with a mean age of 21.7 ± 2.7 years. To account for the possibility of non-response, an additional 20% of participants were recruited, augmenting the final sample size to 1006 students. Fig. 1 displays the participant recruitment process. The sample was distributed by age group as follows: 424 (42.1%) were aged 18–20 years, and 386
(38.4%) were aged 21–23 years, with these two groups constituting the majority. The participants were selected from six academic units: the Medical Institute (17.6%), the Technological Institute (15.0%), the Administrative Institute (16.9%), the College of Medical Technology (17.7%), the College of Engineering Technology (16.1%), and the College of Administrative Technology (16.7%). Based on Body Mass Index (BMI) classifications, the prevalence of overweight and obesity among the students was as follows: overweight, 19.1% (n = 192); and obesity, 8.4% (n = 84). Hence, the overall prevalence of overweight and obesity was 27.5%. Statistical analysis revealed no statistically significant association between sex and BMI categories (p = 0.117, 95% CI = 0.093-0.132). Even though females comprised a larger proportion of the sample, their distribution across BMI categories did not differ significantly from that of males. Nevertheless, Statistical analysis presented a significant correlation between age group and BMI category (p=0.007, 95% CI = 0.002-0.013), with higher rates of overweight and obesity observed in older age groups (21-23 years and 27-30 years) than in younger students (Table 1).
A stepwise multiple linear regression model was constructed to identify independent predictors of BMI, as outlined in Table 2. Variables with p-values < 0.25 from binary analyses were included in the initial model, and non-significant variables (p > 0.05) were then excluded using stepwise exclusion. Multiple linear correlation tests confirmed that all variance inflation (VIF) coefficients were < 10, reflecting no significant multicollinearity among predictors. The final regression model identified nine independent predictors for BMI, together explaining approximately 4% of the variance in BMI (adjusted R² = 0.037, F [2,1004] = 26.724, p < 0.001). Age emerged as the strongest predictor (β = 0.173, B = 0.251, p < 0.001), followed by female gender (β = 0.116, B = 0.931, p < 0.001), which was also a significant predictor. Table 2 reported the unstandardized (B) and standardized (β) regression coefficients for each predictor in the regression model (Table 2).
Table 2. Predictions of Obesity in Relation to Socio-demographic Factors (n= 1006)
| Predictors | R2 | Adjusted R2 | B | β | t | P value |
| Age per years | 0.026 | 0.025 | 0.251 | 0.173 | 5.571 | < 0.001 |
| female gender | 0.039 | 0.037 | 0.931 | 0.116 | 3.726 | < 0.001 |
Note: B = Unstandardized Coefficients (weights indicate the predicted change in the criterion associated with a 1-unit change in the relevant predictor, after controlling for the effects of all the other predictors in the model.), β = Standardized Coefficients (weights indicate the predicted change in standard deviations (SD) – in the criterion associated with a 1 SD change in the relevant predictor, after controlling for the effects of the remaining predictors in the model). All variance inflation factors (VIF) were < 10. The Constant (B = 18.058) represents the estimated baseline value of BMI when all predictor variables in the model are equal to zero.
Discussion
The findings from the study undertaken at the Southern Technical University (STU) in Basrah, Iraq, which reported overweight and obesity prevalence rates of 19.1% and 8.4%, respectively, reveal a concerning but comparatively lower burden of excess weight among STU students compared with recent regional studies. Compared with the 2023 cross-sectional study at the University of Hail, Saudi Arabia [6], which reported overweight and obesity rates of 26.4% and 17.1%, respectively, the Iraqi sample exhibits notably lower prevalence, particularly for obesity [4]. This discrepancy may be attributed to several factors, including differences in dietary transitions, socioeconomic contexts, and lifestyle patterns between the two regions. The Saudi study highlighted significant correlations with frequent restaurant meal consumption, emotional eating, and low physical activity. These factors may be less pronounced or differently manifested in the Iraqi student population. The lower rates in the Iraqi sample may reflect differences in data collection timing, dietary habits, or physical activity infrastructure. One possible reason for the lower prevalence observed in our sample, compared to the Saudi study, is the timing of data collection. Our data were collected along the academic year.
In contrast, other studies might be undertaken during periods of less academic pressure, such as holidays. The academic year is often linked to less time for physical activity, but a more structured lifestyle may also characterize it. Further, the timing may not have captured seasonal shifts in dietary habits and physical activity during the summer months in Iraq, where high temperatures can result in diminished outdoor activity and altered eating patterns. This highlights the need for future longitudinal studies that account for seasonal variations as well as changes related to the academic calendar.
Nevertheless, despite the relatively lower prevalence, the fact that over a quarter of students are still affected signals a significant public health concern, particularly given the long-term health risks associated with obesity. This finding accords with a worrying regional trend of rising obesity rates in the Middle East and North Africa, a region experiencing rapid shifts in dietary and lifestyle patterns [12]. Although students are often perceived as a relatively healthy demographic, this study emphasizes that they are not immune to the broader environmental and social factors contributing to the obesity epidemic.
The strong age predictor of BMI (p < 0.001), with a higher prevalence in older age groups (21–23 and 27–30 years), is concordant with published studies [13]. This trend likely reflects the cumulative effect of ongoing unhealthy lifestyle habits adopted upon entering university. The transition to independent living is often linked to poor dietary choices, irregular sleep patterns, stress, and a reduction in structured physical activity, a well-documented phenomenon known as "first-year university weight gain," which appears to persist throughout university studies [14]. The observed age gradient suggests that, without intervention, weight gain may continue, elevating the risk of developing non-communicable diseases such as diabetes and hypertension in late adulthood, particularly concerning Iraq, which confronts an increasing double burden of disease [15]. Also, older students may have greater financial independence, resulting in increased consumption of energy-dense foods, or may experience metabolic changes associated with ageing [16].
Note the prevalence of underweight (7.2%) warrants attention alongside the findings of overweight and obesity. This coexistence of underweight and overweight within the same student cohort reflects the double burden of malnutrition, which is increasingly witnessed in low- and middle-income countries undergoing nutritional transitions [17]. The presence of both underweight and overweight in the same group signals demographic diversity among students, with varying socioeconomic backgrounds, dietary patterns, and health behaviors. This double burden presents a complex public health challenge, requiring interventions tailored to the specific needs of both underweight and overweight students, rather than a one-size-fits-all approach to nutrition as well as health promotion. Our regression analysis confirmed that female gender is a significant independent predictor of high BMI (p < 0.001), in accordance with the findings of Obirikorang et al. [18], who reported that female students in Ghana are 1.8 to 2.5 times more likely to be obese. Alruwaili et al. [19] as well as Aggad [20] reported that female university students in Saudi Arabia have higher rates of overweight and obesity than male students. This gender disparity can be assigned to several factors, including lower levels of physical activity among females, cultural norms that may discourage strenuous exercise, and differing body image perceptions [18, 19]. The strengths of this study included its large sample size, multi-stage sampling method, and the application of multiple regression analysis. Nevertheless, several limitations of this study should be acknowledged. First, using body mass index (BMI) as the sole anthropometric measure of obesity has significant limitations. Further, the cross-sectional design of this study prevents any causal inferences regarding the relationship between age and obesity; we can only describe correlations, not temporal or causal relationships. Also, our study did not collect experimental data on dietary intake, physical activity levels, sleep patterns, stress, or other lifestyle factors that might help explain BMI distribution and age-related trends. In addition, since this study was conducted at a single university in Basrah, the findings may not be generalizable to all university students in Iraq, particularly those studying at universities in other governorates with different socioeconomic and cultural contexts. Finally, students who chose to participate may have different health behaviors or profiles than those who declined, which could influence the results (volunteer bias).
Conclusion
This study documented high rates of overweight and obesity among students at Southern Technical University in Basrah, Iraq. Age and female gender were identified as significant independent predictors for elevated BMI. These cross-sectional findings highlight a serious public health problem among university students, especially among females. While further research is required to identify causal pathways, university systems should consider implementing evidence-based interventions to address modifiable risk factors as well as mitigate the future burden of non-communicable diseases among this population."
Acknowledgments
The authors would like to thank the participants for their help.
Conflict of interest
None declared.
Funding
This work was partially supported by Southern Technical University through in-kind contributions (equipment/software), under scientific research awards, No. 9/7934, 10 Sep. 2025
Ethical Considerations
Participation was voluntary, and confidentiality was maintained. Students were provided with the necessary information about the study, with participants signing an informed consent form. The researchers explained to the participants that their participation was voluntary and would not affect their university performance. The study was undertaken in accordance with the Helsinki Declaration on Medical Research Ethics.
Code of Ethics
Ethical approval was obtained from the Medical Ethics Committee and the Scientific Research Unit of STU (IRB-STU 7/27/199 of October 10, 2024).
Authors' Contributions
Saman Agad Hashim - Conceptualization, Methodology, Writing Original Draft, Software, Visualization, Data Analysis and Supervision; Ali Hamid Ibrahim - Data Curation, Formal Analysis, Writing - Review & Editing, Supervised manuscript submission, liaised with the journal, and verified reviews; Alia Mohamed Adulateef - Investigation, Resources, and Validation.
The findings from the study undertaken at the Southern Technical University (STU) in Basrah, Iraq, which reported overweight and obesity prevalence rates of 19.1% and 8.4%, respectively, reveal a concerning but comparatively lower burden of excess weight among STU students compared with recent regional studies. Compared with the 2023 cross-sectional study at the University of Hail, Saudi Arabia [6], which reported overweight and obesity rates of 26.4% and 17.1%, respectively, the Iraqi sample exhibits notably lower prevalence, particularly for obesity [4]. This discrepancy may be attributed to several factors, including differences in dietary transitions, socioeconomic contexts, and lifestyle patterns between the two regions. The Saudi study highlighted significant correlations with frequent restaurant meal consumption, emotional eating, and low physical activity. These factors may be less pronounced or differently manifested in the Iraqi student population. The lower rates in the Iraqi sample may reflect differences in data collection timing, dietary habits, or physical activity infrastructure. One possible reason for the lower prevalence observed in our sample, compared to the Saudi study, is the timing of data collection. Our data were collected along the academic year.
In contrast, other studies might be undertaken during periods of less academic pressure, such as holidays. The academic year is often linked to less time for physical activity, but a more structured lifestyle may also characterize it. Further, the timing may not have captured seasonal shifts in dietary habits and physical activity during the summer months in Iraq, where high temperatures can result in diminished outdoor activity and altered eating patterns. This highlights the need for future longitudinal studies that account for seasonal variations as well as changes related to the academic calendar.
Nevertheless, despite the relatively lower prevalence, the fact that over a quarter of students are still affected signals a significant public health concern, particularly given the long-term health risks associated with obesity. This finding accords with a worrying regional trend of rising obesity rates in the Middle East and North Africa, a region experiencing rapid shifts in dietary and lifestyle patterns [12]. Although students are often perceived as a relatively healthy demographic, this study emphasizes that they are not immune to the broader environmental and social factors contributing to the obesity epidemic.
The strong age predictor of BMI (p < 0.001), with a higher prevalence in older age groups (21–23 and 27–30 years), is concordant with published studies [13]. This trend likely reflects the cumulative effect of ongoing unhealthy lifestyle habits adopted upon entering university. The transition to independent living is often linked to poor dietary choices, irregular sleep patterns, stress, and a reduction in structured physical activity, a well-documented phenomenon known as "first-year university weight gain," which appears to persist throughout university studies [14]. The observed age gradient suggests that, without intervention, weight gain may continue, elevating the risk of developing non-communicable diseases such as diabetes and hypertension in late adulthood, particularly concerning Iraq, which confronts an increasing double burden of disease [15]. Also, older students may have greater financial independence, resulting in increased consumption of energy-dense foods, or may experience metabolic changes associated with ageing [16].
Note the prevalence of underweight (7.2%) warrants attention alongside the findings of overweight and obesity. This coexistence of underweight and overweight within the same student cohort reflects the double burden of malnutrition, which is increasingly witnessed in low- and middle-income countries undergoing nutritional transitions [17]. The presence of both underweight and overweight in the same group signals demographic diversity among students, with varying socioeconomic backgrounds, dietary patterns, and health behaviors. This double burden presents a complex public health challenge, requiring interventions tailored to the specific needs of both underweight and overweight students, rather than a one-size-fits-all approach to nutrition as well as health promotion. Our regression analysis confirmed that female gender is a significant independent predictor of high BMI (p < 0.001), in accordance with the findings of Obirikorang et al. [18], who reported that female students in Ghana are 1.8 to 2.5 times more likely to be obese. Alruwaili et al. [19] as well as Aggad [20] reported that female university students in Saudi Arabia have higher rates of overweight and obesity than male students. This gender disparity can be assigned to several factors, including lower levels of physical activity among females, cultural norms that may discourage strenuous exercise, and differing body image perceptions [18, 19]. The strengths of this study included its large sample size, multi-stage sampling method, and the application of multiple regression analysis. Nevertheless, several limitations of this study should be acknowledged. First, using body mass index (BMI) as the sole anthropometric measure of obesity has significant limitations. Further, the cross-sectional design of this study prevents any causal inferences regarding the relationship between age and obesity; we can only describe correlations, not temporal or causal relationships. Also, our study did not collect experimental data on dietary intake, physical activity levels, sleep patterns, stress, or other lifestyle factors that might help explain BMI distribution and age-related trends. In addition, since this study was conducted at a single university in Basrah, the findings may not be generalizable to all university students in Iraq, particularly those studying at universities in other governorates with different socioeconomic and cultural contexts. Finally, students who chose to participate may have different health behaviors or profiles than those who declined, which could influence the results (volunteer bias).
Conclusion
This study documented high rates of overweight and obesity among students at Southern Technical University in Basrah, Iraq. Age and female gender were identified as significant independent predictors for elevated BMI. These cross-sectional findings highlight a serious public health problem among university students, especially among females. While further research is required to identify causal pathways, university systems should consider implementing evidence-based interventions to address modifiable risk factors as well as mitigate the future burden of non-communicable diseases among this population."
Acknowledgments
The authors would like to thank the participants for their help.
Conflict of interest
None declared.
Funding
This work was partially supported by Southern Technical University through in-kind contributions (equipment/software), under scientific research awards, No. 9/7934, 10 Sep. 2025
Ethical Considerations
Participation was voluntary, and confidentiality was maintained. Students were provided with the necessary information about the study, with participants signing an informed consent form. The researchers explained to the participants that their participation was voluntary and would not affect their university performance. The study was undertaken in accordance with the Helsinki Declaration on Medical Research Ethics.
Code of Ethics
Ethical approval was obtained from the Medical Ethics Committee and the Scientific Research Unit of STU (IRB-STU 7/27/199 of October 10, 2024).
Authors' Contributions
Saman Agad Hashim - Conceptualization, Methodology, Writing Original Draft, Software, Visualization, Data Analysis and Supervision; Ali Hamid Ibrahim - Data Curation, Formal Analysis, Writing - Review & Editing, Supervised manuscript submission, liaised with the journal, and verified reviews; Alia Mohamed Adulateef - Investigation, Resources, and Validation.
References
1. NCD Risk Factor Collaboration (NCD-RisC). Worldwide trends in underweight and obesity from 1990 to 2022: a pooled analysis of 3663 population-representative studies with 222 million children, adolescents, and adults. Lancet. 2024'403(10431):1027-50. [DOI] [PMID] [PMCID]
2. Ahmed SK, Mohammed RA. Obesity: Prevalence, causes, consequences, management, preventive strategies and future research directions. Metabol Open. 2025;27:100375. [DOI] [PMID] [PMCID]
3. Nikoloski Z. Obesity in Middle East. In: Ahima RS. (eds). Metabolic Syndrome. Cham: Springer; 2023. [DOI]
4. Karim BH, Ramzi ZS. Prevalence and Awareness of Obesity and Overweight Among Sulaimani University Students in Kurdistan, Iraq. Hilla Univ Coll J Med Sci. 2026;4:94-102. [DOI]
5. Moral-Moreno L, Flores-Ferro E, Cid FM, Vizcarra I, Benítez-Arciniega AD, García EG, et al. Risk Profiles of Poor Diet Quality Among University Students: A Multivariate Segmentation Analysis. Nutrients. 2025;17(23):3639. [DOI] [PMID] [PMCID]
6. Alrubaiee GG, Alqalah TA, Alkubati SA, Al-Rabeei NA. Overweight and obesity among Saudi university students and their relationships with various lifestyle habits: a cross-sectional study. BMC Public Health. 2025;25(1):2021. [DOI] [PMID] [PMCID]
7. Santana CCA, Hill JO, Azevedo LB, Gunnarsdottir T, Prado WL. The association between obesity and academic performance in youth: a systematic review. Obes Rev. 2017;18(10):1191-9. [DOI] [PMID]
8. Moramarco S, Cicala M, Basa FB, Akhshirsh GS, Bezenchek A, Adhama RSL, et al. Exploring health needs and the double burden of disease in adults attending public health facilities in the Iraqi Kurdistan. Front Public Health. 2025;13:1649273. [DOI] [PMID] [PMCID]
9. Ahmed HD, Sabbar HM. University Climate among University Students. J Tikrit Univ Humanit. 2025;32(4):322-41. [DOI]
10. Pengpid S, Peltzer K. Overweight and Obesity among Adults in Iraq: Prevalence and Correlates from a National Survey in 2015. Int J Environ Res Public Health. 2021;18(8):4198. [DOI] [PMID] [PMCID]
11. World Health Organization. The international classification of adult underweight, overweight and obesity according to BMI. Geneva, Switzerland: World Health Organization; 2004.
12. GBD 2015 Obesity Collaborators; Afshin A, Forouzanfar MH, Reitsma MB, Sur P, Estep K, Lee A, et al. Health Effects of Overweight and Obesity in 195 Countries over 25 Years. N Engl J Med. 2017;377(1):13-27. [DOI] [PMID] [PMCID]
13. Khaleghi AA, Salari N, Darvishi N, Bokaee S, Jafari S, Hemmati M, et al. Global prevalence of obesity in the older adults: A meta-analysis. Public Health Pract (Oxf). 2025;9:100585. [DOI] [PMID] [PMCID]
14. Vadeboncoeur C, Townsend N, Foster C. A meta-analysis of weight gain in first year university students: is freshman 15 a myth? BMC Obes. 2015;2:22. [DOI] [PMID] [PMCID]
15. Jawad M, Vamos EP, Najim M, Roberts B, Millett C. Impact of armed conflict on cardiovascular disease risk: a systematic review. Heart. 2019;105(18):1388-94. [DOI] [PMID]
16. Lachat C, Nago E, Verstraeten R, Roberfroid D, Van Camp J, Kolsteren P. Eating out of home and its association with dietary intake: A systematic review of the evidence. Obes Rev. 2012;13(4):329-46. [DOI] [PMID]
17. Adeomi A, Fatusi A, Klipstein-Grobusch K. Double burden of malnutrition among school-aged children and adolescents: evidence from a community-based cross-sectional survey in two Nigerian States. AAS Open Res. 2021;4:38. [DOI] [PMID] [PMCID]
18. Obirikorang C, Adu EA, Anto EO, Afum-Adjei Awuah A, Fynn ANB, Osei-Somuah G, et al. Prevalence and risk factors of obesity among undergraduate student population in Ghana: an evaluation study of body composition indices. BMC Public Health. 2024;24(1):877. [DOI] [PMID] [PMCID]
19. Alruwaili BF, Bayyumi DF, Alruwaili OS, Alsadun RS, Alanazi AS, Hadi A, et al. Prevalence and Determinants of Obesity and Overweight Among Children and Adolescents in the Middle East and North African Countries: An Updated Systematic Review. Diabetes Metab Syndr Obes. 2024;17:2095-103. [DOI] [PMID] [PMCID]
Send email to the article author
| Rights and permissions | |
 |
This work is licensed under a Creative Commons Attribution 4.0 International License. |