Journal of Occupational
Health and Epidemiology

Rafsanjan university Of medical sciences
Volume 15, Issue 1 (Winter 2026)
J Occup Health Epidemiol 2026, 15(1): 56-66 |
Back to browse issues page



Ethics code: no


Download citation:
BibTeX | RIS | EndNote | Medlars | ProCite | Reference Manager | RefWorks
Send citation to:


BibTeX | RIS | EndNote | Medlars | ProCite | Reference Manager | RefWorks
Send citation to:
Pylaeva I, Podshivalova M. Occupational Accidents in an Industrial City: Are Causative Agents’ Employee- and Employer-Related?. , J Occup Health Epidemiol. 2026; 15 (1) :56-66
URL: http://johe.rums.ac.ir/article-1-1114-en.html
URL: http://johe.rums.ac.ir/article-1-1114-en.html
Related article in
Google Scholar
Google Scholar
Similar articles


1- Ph.D. in Economics, Freelance researcher, Chelyabinsk, Russia. , irenpylaeva74@gmail.com
2- Ph.D. in Economics, Department of Economics and Finance, South Ural State University, Chelyabinsk, Russia.
2- Ph.D. in Economics, Department of Economics and Finance, South Ural State University, Chelyabinsk, Russia.
Article history

Received: 2025/09/20
Accepted: 2025/12/21
ePublished: 2026/03/30
Accepted: 2025/12/21
ePublished: 2026/03/30
Subject:
Occupational Health
Keywords: Occupational Injuries [MeSH], Logistic Models [MeSH], Wounds and Injuries [MeSH], Industry [MeSH], Accident Prevention [MeSH]
Full-Text [PDF 665 kb]
(329 Downloads)
| Abstract (HTML) (1169 Views)
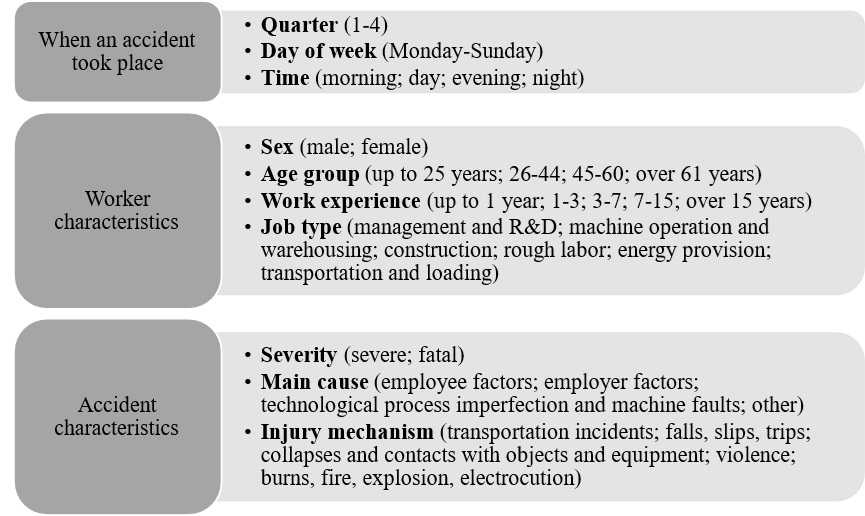
Fig. 1. Overview of study variables employed in coding the initial data
Table 1. Variable coding table
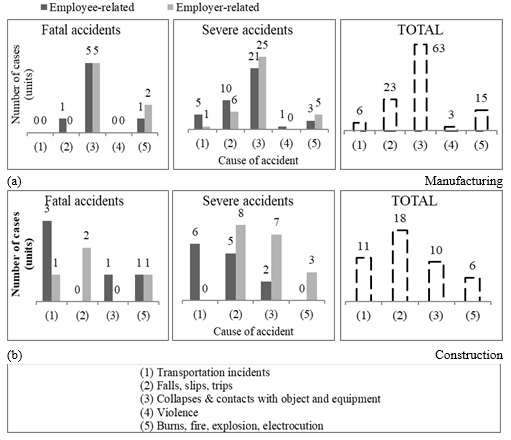
Fig. 2. The distribution of injury mechanisms
Table 3. Industrial accidents (Employee-related causes)
Table 4. Industrial accidents (Employer-related causes)
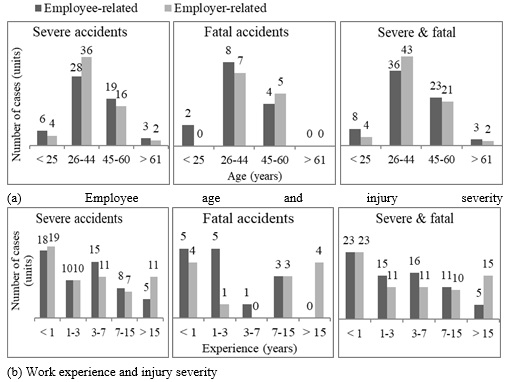
Fig. 3. Distribution of occupational accidents in groups of employee age and work experience with correspondence to injury severity and two main causes
Full-Text: (12 Views)
Introduction
Currently, a large body of knowledge on the specifics of occupational accidents in almost every industry in most developed and developing countries has been established and accident patterns have been identified. Researchers, applying modern statistical methods, study various aspects of occupational safety in the industrial sector, focusing on causes of accidents. It is important to note that the authors of these studies employ various cause classifications for their analysis.
Carrillo-Castrillo et al. [1] researched the most common causes and mechanisms of accidents in the Spanish manufacturing sector, splitting them into active and latent and applying categorical data analysis. Based on their data, 71% of the identified causes are latent, and as such there is a need for greater efforts in the areas of
organization, safety management, and behaviour. Baby et al. [2] dealt with personal and safety climate factors, but only in a specific industry. They utilized the example of electrical accidents to analyse such factors as self-esteem, job stress, personal stress, social support, and fatigue. As can be observed, the majority of these factors are more closely linked to the psychological state of workers than with their behaviour (actions). Elsewhere, Kazan & Usmen [3] analysed construction equipment accidents in the US. They concluded that inadequate safety training, missing equipment protective system, being a non-:union: worker, being an equipment operator and being on or around inadequately maintained equipment yielded higher odds for fatality. In this research, the authors did not differentiate the causes into employee- and employer-related factors.
Nwankwo et al. [4] researched the most common causes of catastrophic accidents in the oil and gas industry, considering that the integration of human causal factors with technical and organizational factors provides more objective results concerning the true causes of accidents. Fuentes-Bargues et al. [5] explored the relationship between various factors and industrial accidents in the Spanish metallurgical sector. They classified the factors into four groups: personal, business, material, and time, emphasizing that worker-related characteristics are especially important in production processes and the accident rate. Based on their results, The Monday effect, meal breaks, and being near retirement age are the most important factors affecting the number of serious accidents in the metal sector. As can be observed, all of these are employee-related factors.
While the aforementioned cause classifications are undoubtedly important for a deeper analysis, they do not exactly provide sufficient details in terms of accountability for the incident, which rests with both the employer and the employee. Currently, there is a lack of research examining occupational accidents through the lens of such a classification.
Another research aspect in modern studies of occupational accidents is inspecting the causes of fatalities. Gonzalez-Delgado et al. [6] dealt with this issue using the example of Mexican workers at an economy-wide level. At the industry level, a few works exist. One of them has evaluated disparities in unintentional occupational fatalities occurring in North Carolina [7], while another has explored the causes of fatal and severe accidents in the US electric power industry [8]. Olcay et al. [9] used the example of the construction industry to appraise the relationship between the characteristics of cases and the number of fatalities. This study scrutinized factors such as type of project, geographic zone, accident type, worker's profession, injured body area, construction site, and accident environment. Other authors ascertained the influence of age on the frequency of fatal industrial accidents [10, 11], analysed the accidental deaths caused by jamming or crushing in the manufacturing industry [12], researched the types of events that preceded serious and fatal accidents in surface, underground, and total mining [13]. We did not find any research that utilized employer- and employee-related classification for exploring the causes of fatalities in diverse industries.
To the best of our knowledge, no studies to date have specifically analysed occupational accidents in industrial cities or employed data on Russian industrial accidents. This study fills this gap and is the first to explore the interaction between causal categories of occupational accidents in a Russian industrial city. As part of this study, all occupational accidents that took place in the city of Chelyabinsk from 2018 to 2021 were analysed. The analysis period was limited by the availability of data provided by the State Labor Inspectorate. This study was conducted using quantitative data analysis, including structural analysis, cross-tabulation analysis, and binary logistic regression models. The aim of our research has been to identify the relative contribution of employer- and employee-related factors to severe and fatal accidents in Chelyabinsk’s industrial sector. The rationale for utilizing an “employee-related vs. employer-related” classification is supported by the following arguments. First, industrial occupational accidents frequently emanate from a combination of inappropriate employee behaviour and personal factors (such as unsafe acts, young age, lack of experience, low education, and health problems) and employer practices (including poor safety management and hazardous environments). Preventing these incidents effectively therefore demands a focus on both sets of factors. Further, analysing the causes of injuries (fatal and severe cases) in the context of employer and worker responsibility allows not only for a deeper understanding of accident root causes but also for taking more effective preventive measures in production management.
Chelyabinsk is an industrial city located in the central part of Russia. In 2024, the total population was 1.18 million, with the average number of employed individuals being 331,439, of whom approximately 35% were recruited in the industrial sector (manufacturing, construction, power generation, water, gas distribution) [14]. This segment of the workforce, predominantly in the metallurgical industry, is employed in potentially hazardous conditions owing to the prevailing association of the industrial sector with the risk of injury. Metallurgical production generates approximately 62% of the region's income. The automative, chemical, and food production industries generate 10%, 11%, and 8% of the region's gross domestic product, respectively.
The highest rate of severe occupational incidence is found in the construction industry (251 per 100,000 employees), followed by the manufacturing industry (24.5) [14]. It is therefore essential to identify the factors in occupational accidents as well as the groups of the labour force overrepresented in severe and fatal accidents. According to the Russian Labour Code, a fatal occupational accident is an accident when the victim is afflicted by a fatal injury, while a severe accident is an accident when the victim is harmed by an injury classified as severe (injuries resulting in the loss of limbs, hearing, vision or speech, or the loss of labour capacity by 30% or more, category I disability, or loss of reproductive function). We chose these two categories of accidents for analysis as they have the most serious consequences for both the employer and the employee. Most countries have laws and regulations that require employers to inspect and prevent fatal as well as severe occupational accidents. The retrospective analysis of such cases will help employers to comply with these regulations by more accurately appraising injury risks, ameliorating safety measures, and protecting employees from potential hazards.
Materials and Methods
According to the Russian law, it is obligatory for businesses to report occupational accidents, with the information being sent to the State Labour Inspectorate, the Occupational Safety Department, and insurance companies. Therefore, information based on the authors' coding (Table 1) was requested from the State Labour Inspectorate, for severe and fatal accidents in the industrial sector while not including accidents classified as non-occupational (chronic disease such as heart attack or stroke, suicide, murder, etc.). The coding system was developed jointly by the authors based on the literature review and international classifications. The brief content of Table 1 is depicted in Fig. 1, where the "main cause" is the primary factor attributed to accident occurrence, classified based on official investigation records. The "mechanism of injury" refers to the physical manner in which the injury occurred; the "type of occupation" is worker roles grouped according to job responsibilities and hazard profile.
Currently, a large body of knowledge on the specifics of occupational accidents in almost every industry in most developed and developing countries has been established and accident patterns have been identified. Researchers, applying modern statistical methods, study various aspects of occupational safety in the industrial sector, focusing on causes of accidents. It is important to note that the authors of these studies employ various cause classifications for their analysis.
Carrillo-Castrillo et al. [1] researched the most common causes and mechanisms of accidents in the Spanish manufacturing sector, splitting them into active and latent and applying categorical data analysis. Based on their data, 71% of the identified causes are latent, and as such there is a need for greater efforts in the areas of
organization, safety management, and behaviour. Baby et al. [2] dealt with personal and safety climate factors, but only in a specific industry. They utilized the example of electrical accidents to analyse such factors as self-esteem, job stress, personal stress, social support, and fatigue. As can be observed, the majority of these factors are more closely linked to the psychological state of workers than with their behaviour (actions). Elsewhere, Kazan & Usmen [3] analysed construction equipment accidents in the US. They concluded that inadequate safety training, missing equipment protective system, being a non-:union: worker, being an equipment operator and being on or around inadequately maintained equipment yielded higher odds for fatality. In this research, the authors did not differentiate the causes into employee- and employer-related factors.
Nwankwo et al. [4] researched the most common causes of catastrophic accidents in the oil and gas industry, considering that the integration of human causal factors with technical and organizational factors provides more objective results concerning the true causes of accidents. Fuentes-Bargues et al. [5] explored the relationship between various factors and industrial accidents in the Spanish metallurgical sector. They classified the factors into four groups: personal, business, material, and time, emphasizing that worker-related characteristics are especially important in production processes and the accident rate. Based on their results, The Monday effect, meal breaks, and being near retirement age are the most important factors affecting the number of serious accidents in the metal sector. As can be observed, all of these are employee-related factors.
While the aforementioned cause classifications are undoubtedly important for a deeper analysis, they do not exactly provide sufficient details in terms of accountability for the incident, which rests with both the employer and the employee. Currently, there is a lack of research examining occupational accidents through the lens of such a classification.
Another research aspect in modern studies of occupational accidents is inspecting the causes of fatalities. Gonzalez-Delgado et al. [6] dealt with this issue using the example of Mexican workers at an economy-wide level. At the industry level, a few works exist. One of them has evaluated disparities in unintentional occupational fatalities occurring in North Carolina [7], while another has explored the causes of fatal and severe accidents in the US electric power industry [8]. Olcay et al. [9] used the example of the construction industry to appraise the relationship between the characteristics of cases and the number of fatalities. This study scrutinized factors such as type of project, geographic zone, accident type, worker's profession, injured body area, construction site, and accident environment. Other authors ascertained the influence of age on the frequency of fatal industrial accidents [10, 11], analysed the accidental deaths caused by jamming or crushing in the manufacturing industry [12], researched the types of events that preceded serious and fatal accidents in surface, underground, and total mining [13]. We did not find any research that utilized employer- and employee-related classification for exploring the causes of fatalities in diverse industries.
To the best of our knowledge, no studies to date have specifically analysed occupational accidents in industrial cities or employed data on Russian industrial accidents. This study fills this gap and is the first to explore the interaction between causal categories of occupational accidents in a Russian industrial city. As part of this study, all occupational accidents that took place in the city of Chelyabinsk from 2018 to 2021 were analysed. The analysis period was limited by the availability of data provided by the State Labor Inspectorate. This study was conducted using quantitative data analysis, including structural analysis, cross-tabulation analysis, and binary logistic regression models. The aim of our research has been to identify the relative contribution of employer- and employee-related factors to severe and fatal accidents in Chelyabinsk’s industrial sector. The rationale for utilizing an “employee-related vs. employer-related” classification is supported by the following arguments. First, industrial occupational accidents frequently emanate from a combination of inappropriate employee behaviour and personal factors (such as unsafe acts, young age, lack of experience, low education, and health problems) and employer practices (including poor safety management and hazardous environments). Preventing these incidents effectively therefore demands a focus on both sets of factors. Further, analysing the causes of injuries (fatal and severe cases) in the context of employer and worker responsibility allows not only for a deeper understanding of accident root causes but also for taking more effective preventive measures in production management.
Chelyabinsk is an industrial city located in the central part of Russia. In 2024, the total population was 1.18 million, with the average number of employed individuals being 331,439, of whom approximately 35% were recruited in the industrial sector (manufacturing, construction, power generation, water, gas distribution) [14]. This segment of the workforce, predominantly in the metallurgical industry, is employed in potentially hazardous conditions owing to the prevailing association of the industrial sector with the risk of injury. Metallurgical production generates approximately 62% of the region's income. The automative, chemical, and food production industries generate 10%, 11%, and 8% of the region's gross domestic product, respectively.
The highest rate of severe occupational incidence is found in the construction industry (251 per 100,000 employees), followed by the manufacturing industry (24.5) [14]. It is therefore essential to identify the factors in occupational accidents as well as the groups of the labour force overrepresented in severe and fatal accidents. According to the Russian Labour Code, a fatal occupational accident is an accident when the victim is afflicted by a fatal injury, while a severe accident is an accident when the victim is harmed by an injury classified as severe (injuries resulting in the loss of limbs, hearing, vision or speech, or the loss of labour capacity by 30% or more, category I disability, or loss of reproductive function). We chose these two categories of accidents for analysis as they have the most serious consequences for both the employer and the employee. Most countries have laws and regulations that require employers to inspect and prevent fatal as well as severe occupational accidents. The retrospective analysis of such cases will help employers to comply with these regulations by more accurately appraising injury risks, ameliorating safety measures, and protecting employees from potential hazards.
Materials and Methods
According to the Russian law, it is obligatory for businesses to report occupational accidents, with the information being sent to the State Labour Inspectorate, the Occupational Safety Department, and insurance companies. Therefore, information based on the authors' coding (Table 1) was requested from the State Labour Inspectorate, for severe and fatal accidents in the industrial sector while not including accidents classified as non-occupational (chronic disease such as heart attack or stroke, suicide, murder, etc.). The coding system was developed jointly by the authors based on the literature review and international classifications. The brief content of Table 1 is depicted in Fig. 1, where the "main cause" is the primary factor attributed to accident occurrence, classified based on official investigation records. The "mechanism of injury" refers to the physical manner in which the injury occurred; the "type of occupation" is worker roles grouped according to job responsibilities and hazard profile.
Fig. 1. Overview of study variables employed in coding the initial data
The complete dataset was composed of 165 cases containing coded information about accident date, time, severity, injury mechanism, leading cause according to the investigation, sex, age (at the time of the accident), work experience (at the time of the accident), job type, and company’s industrial sector. In this way, the inspectorate shared encoded data without giving access to any personal information of the accident victims. Overall, the dataset includes all severe and fatal accidents that took place in the city from 2018 to 2021. Only data from this period was permitted for transmission and processing.
Typically, there are three main groups of occupational accident causes: organizational, human, and technical [4; 30]. Nevertheless, in this study, according to the causes identified in the official reports, we classified groups of causes under the following categories. First, "Technological process imperfection and machine faults" which coincides with "Technical causes" in the original classification, where it is impossible to identify a direct human error, but it is linked to the faulty machines and equipment. Second, "Employer causes" corresponds to organizational causes, and is utilized when the enterprise has been charged and accused of poor work organization. The instances include lack of supervision, providing insufficient training or having workers operate outside their specialty. "Employee causes" implies causes when workers were at fault and correlates with "Human causes". This category's sub-causes, are fore example violations of technical rules; failure to follow organizational and technical documentation, safety requirements or discipline; failure to utilize protective equipment; alcoholic, narcotic, and other intoxication; personal negligence, etc. The "Other" group captures unfavourable natural conditions, the actions of third parties, and any unidentified reasons.
Accident causes were categorized based on the leading cause identified in the official investigation report. If the documented cause referred to the worker’s unsafe actions or violations of rules, the case was classified as employee-related. If it pointed to deficiencies in workplace organization, supervision, equipment, or environment, it was rated as employer-related. The full coding scheme is presented in Table 1.
Typically, there are three main groups of occupational accident causes: organizational, human, and technical [4; 30]. Nevertheless, in this study, according to the causes identified in the official reports, we classified groups of causes under the following categories. First, "Technological process imperfection and machine faults" which coincides with "Technical causes" in the original classification, where it is impossible to identify a direct human error, but it is linked to the faulty machines and equipment. Second, "Employer causes" corresponds to organizational causes, and is utilized when the enterprise has been charged and accused of poor work organization. The instances include lack of supervision, providing insufficient training or having workers operate outside their specialty. "Employee causes" implies causes when workers were at fault and correlates with "Human causes". This category's sub-causes, are fore example violations of technical rules; failure to follow organizational and technical documentation, safety requirements or discipline; failure to utilize protective equipment; alcoholic, narcotic, and other intoxication; personal negligence, etc. The "Other" group captures unfavourable natural conditions, the actions of third parties, and any unidentified reasons.
Accident causes were categorized based on the leading cause identified in the official investigation report. If the documented cause referred to the worker’s unsafe actions or violations of rules, the case was classified as employee-related. If it pointed to deficiencies in workplace organization, supervision, equipment, or environment, it was rated as employer-related. The full coding scheme is presented in Table 1.
Table 1. Variable coding table
| Variable |
| Code | Variable | Code | |||
| Accident severity | Severe (ref.) | 0 | Sex | Male (ref.) | 1 |
| Fatal | 1 | Female | 2 | ||
| Quarter | 1 (ref.) | 1 | Age group (years) | Up to 25 (ref.) | 1 |
| 2 | 2 | 26-44 | 2 | ||
| 3 | 3 | 45-60 | 3 | ||
| 4 | 4 | Over 61 | 4 | ||
| Day | Mon (ref.) | 1 | Work experience (years) | Up to 1 (ref.) | 1 |
| Tue | 2 | 1-3 | 2 | ||
| Wed | 3 | 3-7 | 3 | ||
| Thu | 4 | 7-15 | 4 | ||
| Fri | 5 | Over 15 | 5 | ||
| Sat | 6 | Injury mechanism | Transportation incidents (ref.) | 1 | |
| Sun | 7 | Falls, slips, trips | 2 | ||
| Accident time | Morning (05:00-11:00) (ref.) | 1 | Collapses and contacts with objects and equipment | 3 | |
| Day (11:00-17:00) | 2 | Violence by persons | 4 | ||
| Evening (17:00-23:00) | 3 | Burns, fire, explosion, electrocution | 5 | ||
| Night (23:00-05:00) | 4 | Job type | Management and R&D (administrative personnel, engineer, etc.) (ref.) | 1 | |
| Accident main cause |
Employee factors (violation of work processes or traffic rules, violation of organizational and technical documentation rules, safety requirements, discipline; failure to use protective equipment; a state of alcoholic, narcotic and other intoxication; usage of funds for other purposes; personal negligence) (ref.) | 0 | Machine operation and warehousing (operator, master, tester, inspectors, etc.) | 2 | |
| Employer factors (unsatisfactory organization of work; inadequate supervision; lack of medical examination; improper housekeeping; shortcomings in the training of workers in labor protection or lack of safety documentation; workers employed outside their area of expertise) | 1 | Construction work (concrete worker, welder, mason, roofer, painter, finisher, insulator, etc.) | 3 | ||
| Technological process imperfection and machine faults (design flaws and insufficient reliability of equipment; operation of faulty equipment; unsatisfactory condition of buildings, structures, territory) | 2 | Rough labor, equipment adjustment, application of specialized tools (pour man, refractory man, charge maker, smelter, separator, heat-treater, die press coremaker, caster, straightener, processor of surface defects of metal, cutter, carpenter, driller, turner, setup technician, smith, industrial cleaner, support workers, etc.) | 4 | ||
| Other factors (unfavorable natural conditions; illegal actions of third parties; deterioration of health for unidentified reasons) | 3 | Energy provision (electrician, etc.) | 5 | ||
| Transportation and loading (driver- machinery operator, loader, etc.) | 6 |
Note: (ref.) = reference group for regression models
Table 2. Factors associated with accident severity and causes in the industrial sector and manufacturing industry (OR and CI)
| Dependent variable | Severity | Cause | |||
| Industrial sector | Manufacturing | Industrial sector | Manufacturing | ||
| Model 1 | Model 2 | Model 3 | Model 4 | ||
| Quarter | Base: 1 | ||||
| 2 | 2.588 (0.558-11.99) | 0.813 (0.046-14.171) | 4.712 (1.117-19.86) | 1.764 (0.145-21.36) | |
| 3 | 1.894 (0.345-10.39) | 1.621 (0.027-95.218) | 2.919 (0.705-12.08) | 0.351 (0.024-5.012) | |
| 4 | 1.180 (0.255-5.452) | 11.03 (0.233-521.089) | 9.823 (2.412-39.99) | 5.535 (0.512-59.74) | |
| Weekday | Base: Mon | ||||
| Tue | 1.177 (0.182-7.580) | 17.51 (0.244-.) | 0.484 (0.105-2.212) | 0.933 (0.076-11.37) | |
| Wed | 1.766 (0.275-11.33) | 25.01 (0.296-.) | 0.923 (0.240-3.554) | 0.779 (0.120-5.025) | |
| Thu | 1.395 (0.160-12.11) | 98.02 (0.619-.) | 0.966 (0.212-4.397) | 0.901 (0.085-9.549) | |
| Fri | 1.111 (0.128-9.591) | 0.078 (0.001-5.1) | 0.628 (0.128-3.074) | 0.339 (0.031-3.670) | |
| Sat | 7.502 (0.762-73.87) | . (2.865-.) | 0.134 (0.014-1.260) | 0.073 (0.001-3.563) | |
| Sun | 2.144 (0.251-18.30) | 90.11 (0.662-.) | 0.168 (0.017-1.626) | 0.443 (0.016-11.92) | |
| Injury mechanism | Base: Transportation incidents | ||||
| Falls, slips, trips | 0.148 (0.013-1.638) | . | 19.65 (2.508-154.0) | 1.517 (0.042-54.55) | |
| Collapses & contact with objects | 0.471 (0.064-3.439) | . | 10.46 (1.511-72.41) | 2.190 (0.095-50.11) | |
| Violence | - | . | - | - | |
| Burns, fire, explosion, electrocution | 0.804 (0.091-7.073) | . | 35.15 (3.662-337.4) | 5.617 (0.133-236.1) | |
| Accident severity | Base: Severe | - | - | ||
| Fatal | - | - | 0.541 (0.143-2.052) | 0.358 (0.024-5.323) | |
| Cause | Base: Employee factors | - | - | ||
| Employer factors | 0.627 (0.178-2.206) | 0.056 (0.001-1.91) | - | - | |
| Technological process | 13.39 (1.919-93.46) | 85.40 (0.753-.) | - | - | |
| Other factors | - | - | - | - | |
| Accident time | Base: morning | ||||
| Day | 1.116 (0.305-4.086) | 0.540 (0.031-9.242) | 0.745 (0.256-2.166) | 0.069 (0.007-0.668) | |
| Evening | 0.618 (0.106-3.584) | 0.064 (0.000-4.297) | 0.834 (0.211-3.285) | 0.391 (0.043-3.491) | |
| Night | 7.174 (1.384-37.16) | . (3.423-.) | 2.253 (0.434-11.69) | 2.052 (0.126-33.18) | |
| Age | Base: Up to 25 | ||||
| 26-44 | 7.972 (0.769-82.60) | 1.255 (0.011-142.506) | 1.354 (0.252-7.263) | 0.672 (0.034-12.98) | |
| 45-60 | 12.94 (0.996-168.2) | 1.433 (0.006-295.461) | 0.496 (0.072-3.405) | 0.069 (0.002-2.007) | |
| Over 61 | 12.26 (0.398-377.1) | 43.76 (0.053-.) | 0.038 (0.001-0.890) | 0.001 (0.000-0.717) | |
| Job type | Base: Management and R&D | ||||
| Operators, Warehousing | 16.93 (0.594-482.3) | 5.239 (0.027-997.327) | 8.702 (0.573-132.1) | 167.9 (0.705-.) | |
| Construction work | 20.71 (0.535-800.6) | 20.36 (0.016-.) | 2.111 (0.149-29.72) | - | |
| Rough labor | 3.983 (0.170-93.14) | 0.061 (0.000-11.932) | 4.859 (0.387-60.93) | 16.77 (0.128-.) | |
| Energy provision | 92.83 (2.645-.) | 3.951 (0.007-.) | 5.812 (0.334-100.9) | 22.48 (0.066-.) | |
| Transportation and loading | 11.50 (0.445-297.4) | 1.314 (0.003-559.792) | 3.652 (0.266-50.14) | 24.06 (0.149-.) | |
| Work experience | Base: Up to 1 year | ||||
| 1-3 | 0.613 (0.122-3.059) | 0.061 (0.000-3.864) | 1.343 (0.372-4.848) | 0.565 (0.078-4.098) | |
| 3-7 | 0.228 (0.036-1.441) | 0.032 (0.000-1.586) | 0.674 (0.187-2.432) | 1.044 (0.155-7.002) | |
| 7-15 | 0.717 (0.146-3.516) | 0.125 (0.003-4.648) | 1.386 (0.333-5.773) | 0.134 (0.011-1.558) | |
| Over 15 years | 1.385 (0.180-10.64) | 51.55 (0.301-.) | 24.09 (3.250-178.6) | 164.7 (5.104-.) | |
| Number of obs | 155 | 110 | 140 | 91 | |
Note: “.” = the number is omitted because it is larger than a three-digit number
Initially, the sample structure was analysed to explore the distribution of accident causes by industry. Next, descriptive analysis of occupational accidents was conducted in the form of crosstab representation. This indicated the potentially at-risk groups of workers in relation to employee- and employer-related causes. Thereafter, a logistic regression was applied to identify the factors statistically associated with the occupational accidents in the industrial sector generally, and in the manufacturing industry in particular.
This study employed a binary logistic regression method performed using SPSS 26 to analyse the association between occupational accident severity, accident causes (with a focus on employee- and employer-related causes), and independent factors. A total of four models were utilized (Table 2): Accident severity in the industrial sector (Model 1) and in the manufacturing industry (Model 2); Employee- and employer-related causes of accidents in the industrial sector (Model 3) and in manufacturing industry (Model 4). The sector and dependent variable differ, whereas the independent variables (age, sex, job type, experience, accident date and time, accident main cause, and injury mechanism) were the same in all models. As a dependent variable, The first two models examined factors associated with accident severity (severe vs. fatal) in the industrial sector and the manufacturing industry, while the remaining two models analysed factors related to employee‑ and employer‑related causes of accidents in the same
sectors.
The logistic regression models indicated adequate goodness of fit according to the Hosmer–Lemeshow test. The results were χ² = 13.01, p = 0.11 for accident severity and χ² = 13.54, p = 0.09 for cause. Since p-value is greater than 0.05, we fail to reject the null hypothesis that the model fits the data well. The pseudo R2 value is modest, ranging between 0.28 and 0.54 depending on the model.
Results
Fig. 2 compares employee- and employer-related causes depending on the injury mechanism. We have presented distributions for only 2 of 4 causes (employee- and employer-related) and only for two sectors: manufacturing and construction (there are not enough cases in the utilities industry to provide distribution diagrams). In the diagrams, “TOTAL” signifies the total number of cases for all 4 injury causes depending on the injury mechanism.
The results indicate more employer-related causes in severe accidents related to "Collapses and contacts with objects and equipment" (3) in both industries. Nevertheless, "Falls, slips, trips" (2) in manufacturing refer to employee-related causes while in construction it mostly relates to employer factors. "Transportation incidents" (1) pertain to employee factors in both industries and both types of accident severity. "Burns, fire, explosion, electrocution" mostly refer to employer-related factors.
This study employed a binary logistic regression method performed using SPSS 26 to analyse the association between occupational accident severity, accident causes (with a focus on employee- and employer-related causes), and independent factors. A total of four models were utilized (Table 2): Accident severity in the industrial sector (Model 1) and in the manufacturing industry (Model 2); Employee- and employer-related causes of accidents in the industrial sector (Model 3) and in manufacturing industry (Model 4). The sector and dependent variable differ, whereas the independent variables (age, sex, job type, experience, accident date and time, accident main cause, and injury mechanism) were the same in all models. As a dependent variable, The first two models examined factors associated with accident severity (severe vs. fatal) in the industrial sector and the manufacturing industry, while the remaining two models analysed factors related to employee‑ and employer‑related causes of accidents in the same
sectors.
The logistic regression models indicated adequate goodness of fit according to the Hosmer–Lemeshow test. The results were χ² = 13.01, p = 0.11 for accident severity and χ² = 13.54, p = 0.09 for cause. Since p-value is greater than 0.05, we fail to reject the null hypothesis that the model fits the data well. The pseudo R2 value is modest, ranging between 0.28 and 0.54 depending on the model.
Results
Fig. 2 compares employee- and employer-related causes depending on the injury mechanism. We have presented distributions for only 2 of 4 causes (employee- and employer-related) and only for two sectors: manufacturing and construction (there are not enough cases in the utilities industry to provide distribution diagrams). In the diagrams, “TOTAL” signifies the total number of cases for all 4 injury causes depending on the injury mechanism.
The results indicate more employer-related causes in severe accidents related to "Collapses and contacts with objects and equipment" (3) in both industries. Nevertheless, "Falls, slips, trips" (2) in manufacturing refer to employee-related causes while in construction it mostly relates to employer factors. "Transportation incidents" (1) pertain to employee factors in both industries and both types of accident severity. "Burns, fire, explosion, electrocution" mostly refer to employer-related factors.
Fig. 2. The distribution of injury mechanisms
The total distribution of injury mechanisms indicates that the manufacturing industry claims the highest rate of "Collapses and contacts with objects and equipment," followed by "Falls, slips, and trips." In construction, the highest rates belong to "Falls, slips, and trips," "Transportation incidents," and "Collapses and contacts with objects and equipment."
Matrix analysis: Applying highlighted variables, a comparative table was compiled and analysed in detail below (Table 3-4). The total number of cases in the tables is 140, since only those linked to two types of causes: employee- (70) (Table 3) and employer-related (70) (Table 4) are indicated.
Matrix analysis: Applying highlighted variables, a comparative table was compiled and analysed in detail below (Table 3-4). The total number of cases in the tables is 140, since only those linked to two types of causes: employee- (70) (Table 3) and employer-related (70) (Table 4) are indicated.
Table 3. Industrial accidents (Employee-related causes)
| Accident severity | Gender-Age | Years of experience | Total | ||||
| < 1 | 1-3 | 3-7 | 7-15 | ˃ 15 | |||
| Employee-related (N=70) | |||||||
| Severe (56) | M: < 25 | 3 | 1 | 1 | 1 | 0 | 6 |
| M: 26-44 | 9 | 5 | 7 | 3 | 0 | 24 | |
| M: 45-60 | 4 | 3 | 5 | 3 | 1 | 16 | |
| M: ˃ 61 | 0 | 0 | 0 | 0 | 3 | 3 | |
| W: < 25 | 0 | 0 | 0 | 0 | 0 | 0 | |
| W: 26-44 | 2 | 1 | 1 | 0 | 0 | 4 | |
| W: 45-60 | 0 | 0 | 1 | 1 | 1 | 3 | |
| W: ˃ 61 | 0 | 0 | 0 | 0 | 0 | 0 | |
| Subtotal | 18 | 10 | 15 | 8 | 5 | 56 | |
| Fatal (14) | M: < 25 | 2 | 0 | 0 | 0 | 0 | 2 |
| M: 26-44 | 2 | 3 | 0 | 2 | 0 | 7 | |
| M: 45-60 | 1 | 1 | 1 | 1 | 0 | 4 | |
| M: ˃ 61 | 0 | 0 | 0 | 0 | 0 | 0 | |
| W: < 25 | 0 | 0 | 0 | 0 | 0 | 0 | |
| W: 26-44 | 0 | 1 | 0 | 0 | 0 | 1 | |
| W: 45-60 | 0 | 0 | 0 | 0 | 0 | 0 | |
| W: ˃ 61 | 0 | 0 | 0 | 0 | 0 | 0 | |
| Subtotal | 5 | 5 | 1 | 3 | 0 | 14 | |
Note: M = man, W = woman
The proportion of men and women injured in occupational accidents is 89% and 11%, respectively. Presumably, this proportion can be explained by the labour force distribution in these industries. Based on local statistics [34], the share of employed women in the manufacturing industry is 35%, in utilities 30%, and in construction 18%.
Table 4. Industrial accidents (Employer-related causes)
| Accident severity | Gender-Age | Years of experience | Total | ||||
| < 1 | 1-3 | 3-7 | 7-15 | ˃ 15 | |||
| Employer-related (N=70) | |||||||
| Severe (58) | M: < 25 | 2 | 1 | 1 | 0 | 0 | 4 |
| M: 26-44 | 15 | 8 | 6 | 3 | 2 | 34 | |
| M: 45-60 | 1 | 1 | 2 | 1 | 7 | 12 | |
| M: ˃ 61 | 0 | 0 | 0 | 1 | 1 | 2 | |
| W: < 25 | 0 | 0 | 0 | 0 | 0 | 0 | |
| W: 26-44 | 1 | 0 | 0 | 1 | 0 | 2 | |
| W: 45-60 | 0 | 0 | 2 | 1 | 1 | 4 | |
| W: ˃ 61 | 0 | 0 | 0 | 0 | 0 | 0 | |
| Subtotal | 19 | 10 | 11 | 7 | 11 | 58 | |
| Fatal (12) | M: < 25 | 0 | 0 | 0 | 0 | 0 | 0 |
| M: 26-44 | 3 | 0 | 0 | 2 | 1 | 6 | |
| M: 45-60 | 1 | 0 | 0 | 0 | 3 | 4 | |
| M: ˃ 61 | 0 | 0 | 0 | 0 | 0 | 0 | |
| W: < 25 | 0 | 0 | 0 | 0 | 0 | 0 | |
| W: 26-44 | 0 | 0 | 0 | 1 | 0 | 1 | |
| W: 45-60 | 0 | 1 | 0 | 0 | 0 | 1 | |
| W: ˃ 61 | 0 | 0 | 0 | 0 | 0 | 0 | |
| Subtotal | 4 | 1 | 0 | 3 | 4 | 12 | |
Note: M = man, W = woman
The ratio of severe and fatal accidents that occurred in the industrial sector over four years is approximately 4 to 1. In the industrial sector, the total number of employee- and employer-related accidents is distributed equally, whereas there are some differences in the samples associated with employee age and work experience.
The most significant number of accidents took place among the core of the labour force: the 26–44 age group (Fig. 3a). This might be explained by the age structure of the employed population. This age category covers 55% of employed in the city. In the sample, within this age category, more than half of the accidents occurred through employer-related causes (54%). The 45–60 age group reverses this accident distribution. The number of severe cases linked to employee-related causes (19) outnumbered employer-related cases (16). Based on Rosstat, the average share of employed in age groups up to 25 and over 61 are almost equal (7%), which could explain the low injury rates in these groups.
Overall, older workers are fatally injured less often (employee-related causes). For employer-related causes, the two most at risk age groups for severe injury are up to 25 and over 61. Nonetheless, the general distribution (including the other two causes) reveals a growing share of fatal accidents with employee age. This might suggest that other, less obvious, causes are involved in accidents (see Section 3.3).
The most significant number of accidents took place among the core of the labour force: the 26–44 age group (Fig. 3a). This might be explained by the age structure of the employed population. This age category covers 55% of employed in the city. In the sample, within this age category, more than half of the accidents occurred through employer-related causes (54%). The 45–60 age group reverses this accident distribution. The number of severe cases linked to employee-related causes (19) outnumbered employer-related cases (16). Based on Rosstat, the average share of employed in age groups up to 25 and over 61 are almost equal (7%), which could explain the low injury rates in these groups.
Overall, older workers are fatally injured less often (employee-related causes). For employer-related causes, the two most at risk age groups for severe injury are up to 25 and over 61. Nonetheless, the general distribution (including the other two causes) reveals a growing share of fatal accidents with employee age. This might suggest that other, less obvious, causes are involved in accidents (see Section 3.3).
Fig. 3. Distribution of occupational accidents in groups of employee age and work experience with correspondence to injury severity and two main causes
The most significant number of accidents was observed in the group of employees with experience of less than a year (Fig. 3b). Accident occurrences generally diminish with increasing years of experience [16], while the total distribution of employed is ascending (where the share of workers with less than a year of experience is up to 10% and more than 10 years is 40%).
A similar distribution is observed between employee- and employer-related causes of accidents in the group with the least experience. The number of industrial accidents with workers in work experience groups 1–3 years, 3–7 years, and 7–15 years, classified as having employee-related causes (42), is 31% higher than that of the same group related to employer-related causes (32). Nevertheless, workers with over 15 years of experience had three times as many accidents due to employer-related causes in absolute terms. The experience of employees can keep them from mistakes resulting in accidents; the least experienced employees could be injured owing to a lack of practice. This is supported by the finding that experienced workers (over 15 years of experience) suffer less often than other groups from employee-related accidents (7%).
In general, if we assume that experience usually accumulates for at least 7 years of working in one area, then it can be concluded that inexperienced (up to 3 years of experience) and insufficiently experienced workers (up to 7 years) are injured through their fault (77% of all cases). Inexperienced and insufficiently experienced workers suffer through employer-related causes less frequently (65% of all cases).
Binary regression analysis: The detailed results of the odds ratio (OR) and the corresponding confidence interval (CI) are reported in Table 2. This section focuses on the significant results (p-value < 0.05) from the table, highlighting factors pertained to accident severity in the industrial sector (Model 1), in the manufacturing industry (Model 2) as well as Employee- and employer-related causes of accidents in the industrial sector (Model 3) and in manufacturing industry (Model 4).
In the industrial sector (Model 1), fatal accidents were significantly more likely to take place along night shifts, in the energy provision occupations, and when attributable to technological process imperfections or machine faults (p < 0.05). In the manufacturing sector (Model 2), fatalities were associated with working at night and on Saturdays.
Factors pertained to employer-related causes of accidents in the industrial sector (Model 3) included working in the second and fourth quarters of the year, injury mechanisms such as "Falls, slips, trips", "Collapses and contacts with object and equipment" and "Burns, fire, explosion, electrocution", and over 15 years of work experience. The only factor correlated with employee-related severe injury or death is age of 61 or older. In the manufacturing industry (Model 4), also age over 61 years and working along the daytime elevated the risk of employee-related causes of accidents, whereas work experience over 15 years was the factors associated with employer-related accidents.
Discussion
To our knowledge, this is the first Russian retrospective study to focus on occupational accidents that occurred in an industrial city and explore the relative contribution of employer- and employee-related factors to severe and fatal accidents in different industries. Importantly, the aim of the discussion section is to compare accident patterns in Chelyabinsk with those observed globally. It is critical to safely adopt successful global practices for mitigating occupational accidents.
The largest number of accidents among industrial companies was connected with “Collapses and contacts with objects and equipment” in manufacturing, followed by “Falls, slips, trips” in the construction industry which correspond to international findings [17-21]. This aligns with [9, 15] in their findings that the incidence of occupational injury remains high in construction.
Fatal accidents were more common at night, on weekends, and in high-production quarters, consistent with prior international findings [5, 22, 23]. This may be linked to there being fewer staff during such shifts, placing a dual burden on them. Not surprisingly, severe and fatal accidents in the 2nd and 4th quarters were associated with employer-related causes as these timeframes are critical to complete mid-year and annual plans which may create pressure resulting in employer negligence and overworked staff.
Organizational and human factors remain the dominant causes of occupational accidents, with lack of supervision, poor organization, noncompliance with safety regulations, as well as violations of operating rules repeatedly identified in the literature [1, 19-21, 24–27]. Consistent with Eskandari et al. [28], our results confirmed that employee-related causes prevailed in manufacturing and utilities, whereas employer-related causes dominated in construction. Technical causes were less frequent but strongly linked to fatalities, as noted in earlier research [3, 4, 21, 27]. Works mentioning technical factors are new and this heightened attention might be because of accelerating technological progress and its influence on the industrial production.
The key result of the study is that the severity of accidents considerably falls with age for employee-related causes, which is in line with Refs. [5, 29-32], but contradicts Peng and Chan [33], who found that the occurrence of severe/fatal accidents among older workers is twice that of younger workers. This discrepancy may be owing to differences in labour composition or research methods; while Peng and Chan relied on a literature review, our study utilized a sample. Workers up to 25 and over 61 years were not involved in any fatal accidents with employer-related causes. Nevertheless, technical causes hold a key role in accident severity mostly for older workers.
Considering work experience, we find that workers with over 15 years of experience are at a higher risk than other groups for employer-related causes, which to some extent contradicts Refs. [6, 29]. They found less experienced workers (with up to 10 years of experience) to be more likely to be injured regardless of the cause. Once again, this contradiction is common in existing literature and is often explained by occupational and measurement factors linked to accidents [33].
Overall, we recommend closer supervision of high-risk groups (core-age workers, night/weekend shifts, and those with >15 years’ experience), mandatory mentoring for new employees, as well as proactive safety measures for an aging workforce.
Note that this study had the following limitations. First, the factors connected with the causes of accidents were defined along the accident investigation. Despite the investigation process involving at least ten professionals and having been developed to eliminate subjectivity, a subjective component could remain in identifying the cause in every case.
Further, this study was limited by the relatively small number of observed cases and the wide variety of independent factors in the regression model. In general practice, one independent variable in the model should correspond to a sample of at least 10 observations per variable. As a result, the estimation of the factor effect would be more accurate with more observations. We intentionally did not focus on the size of the coefficients and confidence intervals as they may underestimate or overestimate the actual effects. Our primary aim was merely to demonstrate the associations between potentially high-risk groups and types of occupational accident causes. Thus, our results should be interpreted with caution.
Finally, we analysed a standard set of factors (age, work experience, sex, job type, etc.). If accessible, endogeneity factors such as mood, relations in the family, job stress, job dissatisfaction, job responsibility, work performance, living habits, etc. could be surveyed, and an instrumental variable analysis might be applied.
Conclusion
The most at-risk groups of workers were identified as industrial workers with over 15 years of experience, who were strongly linked to employer-related accident causes; working in the 2nd and 4th quarters and certain injury mechanisms (falls, slips, trips; collapses and contacts with objects and equipment; burns, fire, explosion, electrocution). "Technological process imperfection and machine faults", working nightshifts, and jobs in "Energy provision" were mostly associated with fatal accidents in the industrial sector. Matrix analysis revealed the highest incidence among adults aged 26–44 years and workers with less than one year of experience, indicating the dominant structure of the labour force. Overall, city employees with more than 15 years of experience were disproportionately affected by employer-related incidents, suggesting that system or organizational factors increasingly contribute to risk as experience accumulates. This analysis provided valuable insights for industrial enterprises that could result in improved occupational safety.
Acknowledgements
The authors would like to express their gratitude to the Chelyabinsk State Labor Inspectorate for providing access to the data and for their support in the development of this study.
Conflict of interest
None declared.
Funding
The authors received no financial support for the research, authorship, and/or publication of this article.
Ethical Considerations
This study was based on encoded secondary data provided by the Chelyabinsk State Labor Inspectorate. No personally identifiable information was available to the authors; therefore, individual informed consent was not required. The authors confirm that this study was conducted in accordance with accepted ethical standards for research using secondary, de‑identified data.
Authors' Contributions
Irina Pylaeva: Conceptualization, Methodology, Formal analysis, Investigation, Data curation, Visualization, Resources, Writing – original draft. Mariya Podshivalova: Formal analysis, Resources, Supervision, Writing – review & editing. All authors read and approved the final manuscript.
A similar distribution is observed between employee- and employer-related causes of accidents in the group with the least experience. The number of industrial accidents with workers in work experience groups 1–3 years, 3–7 years, and 7–15 years, classified as having employee-related causes (42), is 31% higher than that of the same group related to employer-related causes (32). Nevertheless, workers with over 15 years of experience had three times as many accidents due to employer-related causes in absolute terms. The experience of employees can keep them from mistakes resulting in accidents; the least experienced employees could be injured owing to a lack of practice. This is supported by the finding that experienced workers (over 15 years of experience) suffer less often than other groups from employee-related accidents (7%).
In general, if we assume that experience usually accumulates for at least 7 years of working in one area, then it can be concluded that inexperienced (up to 3 years of experience) and insufficiently experienced workers (up to 7 years) are injured through their fault (77% of all cases). Inexperienced and insufficiently experienced workers suffer through employer-related causes less frequently (65% of all cases).
Binary regression analysis: The detailed results of the odds ratio (OR) and the corresponding confidence interval (CI) are reported in Table 2. This section focuses on the significant results (p-value < 0.05) from the table, highlighting factors pertained to accident severity in the industrial sector (Model 1), in the manufacturing industry (Model 2) as well as Employee- and employer-related causes of accidents in the industrial sector (Model 3) and in manufacturing industry (Model 4).
In the industrial sector (Model 1), fatal accidents were significantly more likely to take place along night shifts, in the energy provision occupations, and when attributable to technological process imperfections or machine faults (p < 0.05). In the manufacturing sector (Model 2), fatalities were associated with working at night and on Saturdays.
Factors pertained to employer-related causes of accidents in the industrial sector (Model 3) included working in the second and fourth quarters of the year, injury mechanisms such as "Falls, slips, trips", "Collapses and contacts with object and equipment" and "Burns, fire, explosion, electrocution", and over 15 years of work experience. The only factor correlated with employee-related severe injury or death is age of 61 or older. In the manufacturing industry (Model 4), also age over 61 years and working along the daytime elevated the risk of employee-related causes of accidents, whereas work experience over 15 years was the factors associated with employer-related accidents.
Discussion
To our knowledge, this is the first Russian retrospective study to focus on occupational accidents that occurred in an industrial city and explore the relative contribution of employer- and employee-related factors to severe and fatal accidents in different industries. Importantly, the aim of the discussion section is to compare accident patterns in Chelyabinsk with those observed globally. It is critical to safely adopt successful global practices for mitigating occupational accidents.
The largest number of accidents among industrial companies was connected with “Collapses and contacts with objects and equipment” in manufacturing, followed by “Falls, slips, trips” in the construction industry which correspond to international findings [17-21]. This aligns with [9, 15] in their findings that the incidence of occupational injury remains high in construction.
Fatal accidents were more common at night, on weekends, and in high-production quarters, consistent with prior international findings [5, 22, 23]. This may be linked to there being fewer staff during such shifts, placing a dual burden on them. Not surprisingly, severe and fatal accidents in the 2nd and 4th quarters were associated with employer-related causes as these timeframes are critical to complete mid-year and annual plans which may create pressure resulting in employer negligence and overworked staff.
Organizational and human factors remain the dominant causes of occupational accidents, with lack of supervision, poor organization, noncompliance with safety regulations, as well as violations of operating rules repeatedly identified in the literature [1, 19-21, 24–27]. Consistent with Eskandari et al. [28], our results confirmed that employee-related causes prevailed in manufacturing and utilities, whereas employer-related causes dominated in construction. Technical causes were less frequent but strongly linked to fatalities, as noted in earlier research [3, 4, 21, 27]. Works mentioning technical factors are new and this heightened attention might be because of accelerating technological progress and its influence on the industrial production.
The key result of the study is that the severity of accidents considerably falls with age for employee-related causes, which is in line with Refs. [5, 29-32], but contradicts Peng and Chan [33], who found that the occurrence of severe/fatal accidents among older workers is twice that of younger workers. This discrepancy may be owing to differences in labour composition or research methods; while Peng and Chan relied on a literature review, our study utilized a sample. Workers up to 25 and over 61 years were not involved in any fatal accidents with employer-related causes. Nevertheless, technical causes hold a key role in accident severity mostly for older workers.
Considering work experience, we find that workers with over 15 years of experience are at a higher risk than other groups for employer-related causes, which to some extent contradicts Refs. [6, 29]. They found less experienced workers (with up to 10 years of experience) to be more likely to be injured regardless of the cause. Once again, this contradiction is common in existing literature and is often explained by occupational and measurement factors linked to accidents [33].
Overall, we recommend closer supervision of high-risk groups (core-age workers, night/weekend shifts, and those with >15 years’ experience), mandatory mentoring for new employees, as well as proactive safety measures for an aging workforce.
Note that this study had the following limitations. First, the factors connected with the causes of accidents were defined along the accident investigation. Despite the investigation process involving at least ten professionals and having been developed to eliminate subjectivity, a subjective component could remain in identifying the cause in every case.
Further, this study was limited by the relatively small number of observed cases and the wide variety of independent factors in the regression model. In general practice, one independent variable in the model should correspond to a sample of at least 10 observations per variable. As a result, the estimation of the factor effect would be more accurate with more observations. We intentionally did not focus on the size of the coefficients and confidence intervals as they may underestimate or overestimate the actual effects. Our primary aim was merely to demonstrate the associations between potentially high-risk groups and types of occupational accident causes. Thus, our results should be interpreted with caution.
Finally, we analysed a standard set of factors (age, work experience, sex, job type, etc.). If accessible, endogeneity factors such as mood, relations in the family, job stress, job dissatisfaction, job responsibility, work performance, living habits, etc. could be surveyed, and an instrumental variable analysis might be applied.
Conclusion
The most at-risk groups of workers were identified as industrial workers with over 15 years of experience, who were strongly linked to employer-related accident causes; working in the 2nd and 4th quarters and certain injury mechanisms (falls, slips, trips; collapses and contacts with objects and equipment; burns, fire, explosion, electrocution). "Technological process imperfection and machine faults", working nightshifts, and jobs in "Energy provision" were mostly associated with fatal accidents in the industrial sector. Matrix analysis revealed the highest incidence among adults aged 26–44 years and workers with less than one year of experience, indicating the dominant structure of the labour force. Overall, city employees with more than 15 years of experience were disproportionately affected by employer-related incidents, suggesting that system or organizational factors increasingly contribute to risk as experience accumulates. This analysis provided valuable insights for industrial enterprises that could result in improved occupational safety.
Acknowledgements
The authors would like to express their gratitude to the Chelyabinsk State Labor Inspectorate for providing access to the data and for their support in the development of this study.
Conflict of interest
None declared.
Funding
The authors received no financial support for the research, authorship, and/or publication of this article.
Ethical Considerations
This study was based on encoded secondary data provided by the Chelyabinsk State Labor Inspectorate. No personally identifiable information was available to the authors; therefore, individual informed consent was not required. The authors confirm that this study was conducted in accordance with accepted ethical standards for research using secondary, de‑identified data.
Authors' Contributions
Irina Pylaeva: Conceptualization, Methodology, Formal analysis, Investigation, Data curation, Visualization, Resources, Writing – original draft. Mariya Podshivalova: Formal analysis, Resources, Supervision, Writing – review & editing. All authors read and approved the final manuscript.
References
1. Carrillo-Castrillo JA, Rubio-Romero JC, Onieva L. Causation of Severe and Fatal Accidents in the Manufacturing Sector. Int J Occup Saf Ergon. 2013;19(3):423-34. [DOI] [PMID]
2. Baby T, Madhu G, Renjith VR. Occupational electrical accidents: Assessing the role of personal and safety climate factors. Saf Sci. 2021;139:105229. [DOI]
3. Kazan E, Usmen MA. Worker safety and injury severity analysis of earthmoving equipment accidents. J Saf Res. 2018;65:73-81. [DOI] [PMID]
4. Nwankwo CD, Arewa AO, Theophilus SC, Esenowo VN. Analysis of accidents caused by human factors in the oil and gas industry using the HFACS-OGI framework. Int J Occup Saf Ergon. 2022;28(3):1642-54. [DOI] [PMID]
5. Fuentes-Bargues JL, Sanchez-Lite A, González-Gaya C, Rosales-Prieto VF, Reniers G. A study of situational circumstances related to Spain’s occupational accident rates in the metal sector from 2009 to 2019. Saf Sci. 2022;150:105700. [DOI]
6. Gonzalez-Delgado M, Gómez-Dantés H, Fernández-Niño JA, Robles E, Borja VH, Aguilar M. Factors Associated with Fatal Occupational Accidents among Mexican Workers: A National Analysis. PLoS One. 2015;10(3):e0121490. [DOI] [PMID] []
7. Martin AT, McClure ES, Ranapurwala SI, Nocera M, Cantrell J, Marshall SW, et al. Fatal occupational injuries in North Carolina, 1992–2017. Occup Environ Med. 2023;80(12):680-6. [DOI] [PMID] []
8. Fordyce TA, Leonhard MJ, Watson HN, Mezei G, Vergara XP, Krishen L. An analysis of fatal and non-fatal injuries and injury severity factors among electric power industry workers. Am J Ind Med. 2016;59(11):948-58. [DOI] [PMID]
9. Olcay ZF, Sakalli AE, Temur S, Yazici A. A study of the shift in fatal construction work-related accidents during 2012–2019 in Turkey. Int J Occup Saf Ergon. 2022;28(3):1522-32. [DOI] [PMID]
10. Hasebe T, Sakai T. Are elderly workers more likely to die in occupational accidents? Evidence from both industry-aggregated data and administrative individual-level data in Japan. Japan World Economy. 2018;48(C):79-89. [DOI]
11. Bravo G, Castellucci I, Lavallière M, Arezes PM, Martínez M, Duarte G. The influence of age on fatal work accidents and lost days in Chile between 2015 and 2019. Saf Sci. 2022;147:105599. [DOI]
12. Kim S, Lee J, Kang C. Analysis of industrial accidents causing through jamming or crushing accidental deaths in the manufacturing industry in South Korea: Focus on non-routine work on machinery. Saf Sci. 2021;133:104998. [DOI]
13. Sanmiquel L, Freijo M, Edo J, Rossell JM. Analysis of work related accidents in the Spanish mining sector from 1982-2006. J Safety Res. 2010;41(1):1-7. [DOI] [PMID]
14. Statistical yearbook for the Chelyabinsk region 2024. Chelyabinskstat. Chelyabinsk, 440. https://74.rosstat.gov.ru/publication_collection/document/42466.
15. Rafieyan A, Sarvari H, Chan DWM. Identifying and Evaluating the Essential Factors Affecting the Incidence of Site Accidents Caused by Human Errors in Industrial Parks Construction Projects. Int J Environ Res Public Health. 2022;19(16):10209. [DOI] [PMID] [PMCID]
16. Bena A, Giraudo M, Leombruni R, Costa G. Job tenure and work injuries: a multivariate analysis of the relation with previous experience and differences by age. BMC Public Health. 2013;13:869. [DOI] [PMID] [PMCID]
17. Yi KH, Lee SS. A Policy Intervention Study to Identify High-Risk Groups to Prevent Industrial Accidents in Republic of Korea. Saf Health Work. 2016;7(3):213-7. [DOI] [PMID] [PMCID]
18. Bellamy LJ, Damen M, Jan Manuel H, Aneziris ON, Papazoglou IA, Oh JIH. Risk horoscopes: Predicting the number and type of serious occupational accidents in The Netherlands for sectors and jobs. Reliab Eng Syst Saf. 2015;133:106-18. [DOI]
19. Yi KH. The High-risk Groups According to the Trends and Characteristics of Fatal Occupational Injuries in Korean Workers Aged 50 Years and Above. Saf Health Work. 2018;9(2):184-91. [DOI] [PMID] [PMCID]
20. Bronnikova EM, Kulyamina OS, Vinogradova MV, Vasilieva LA, Volkov DV, Larionova AA. Safety and labor protection: USA and Russian experience. J Environ Treat Tech. 2019;7:1134-40.
21. Pedrosa HM, Guedes Jc. Characterization of Accidents at Work in the Manufacturing Industry: In the Pursuit of Their Prevention. In: Arezes PM, Baptista JS, Melo RB, Branco JC, Carneiro P, Colim A, et al. editors. Occupational and Environmental Safety and Health IV. Switzerland: Springer Nature; 2023. [DOI]
22. Wang C, Guo E, Cao Y, Zhang H, Zhang Y. Statistical characteristics of production safety accidents and its strategy implications for administrators in Inner Mongolia. Nat Hazards. 2023;117:745-62. [DOI]
23. Kim HW, Lee JW, Kim JH, Cho HD. A study on the establishment of safety and health strategy for the prevention of industrial accidents in the construction company. Forum of Public Safety and Culture. 2025;40:41-58. [DOI]
24. Aksenov V, Zavyalov A, Chaplygin V, Sorokina E. Analysis of industrial injuries and assessment of the risk of injury to railway power supply workers. E3S Web Conf. 2020;157(2):04013. [DOI]
25. Mirzaei Aliabadi M, Aghaei H, Kalatpour O, Soltanian AR, Nikravesh A. Analysis of human and organizational factors that influence mining accidents based on Bayesian network. Int J Occup Saf Ergon. 2020;26(4):670-7. [DOI] [PMID]
26. Niciejewska M, Idzikowski A, Škurková KL. Impact of Technical, Organizational and Human Factors on Accident Rate of Small-Sized Enterprises. Manag Syst Prod Eng. 2021;29(2):139-44. [DOI]
27. Uakhitova В, Ramatullaeva LI, Imangazin MK, Taizhigitova MM, Analysis of the level of occupational injuries on the example of an industrial enterprise of a metallurgical cluster. News Natl Acad Sci Repub Kazakhstan. 2022;1(451):145-51. [DOI]
28. Eskandari D, Jafari MJ, Mehrabi Y, et al. A Qualitative Study on Organizational Factors Affecting Occupational Accidents. Iran J Public Health. 2017; 46(3):380-388.
29. Hanvold TN, Kines P, Nykänen M, Thomée S, Holte KA, Vuori J, et al. Occupational safety and health among young workers in the Nordic countries: A systematic literature review. Saf Health Work. 2019;10(1):3-20. [DOI] [PMID] [PMCID]
30. Farrow A, Reynolds F. Health and safety of the older worker. Occup Med (Lond). 2012;62(1):4-11. [DOI] [PMID]
31. Isa AAM, Wahab WA, Omar RC, Nordin MZM, Taha H, Roslan R. Impact of employee age and work experience on safety culture at workplace. E3S Web Conf. 2021;325:06007. [DOI]
32. Ng TW, Feldman DC. The relationship of age to ten dimensions of job performance. J Appl Psychol. 2008;93(2):392-423. [DOI] [PMID]
33. Peng L, Chan AHS. A meta-analysis of the relationship between ageing and occupational safety and health. Saf Sci. 2019;112:162-72. [DOI]
Send email to the article author
| Rights and permissions | |
 |
This work is licensed under a Creative Commons Attribution 4.0 International License. |