Journal of Occupational
Health and Epidemiology

Rafsanjan university Of medical sciences
Volume 10, Issue 4 (Autumn 2021)
J Occup Health Epidemiol 2021, 10(4): 231-238 |
Back to browse issues page


Download citation:
BibTeX | RIS | EndNote | Medlars | ProCite | Reference Manager | RefWorks
Send citation to:


BibTeX | RIS | EndNote | Medlars | ProCite | Reference Manager | RefWorks
Send citation to:
Ghaneian M T, Tarfiei A, Ehrampoush M H, Lotfi M H, Namayandeh M, Adamizadeh A R et al . An Epidemiological Survey on Factors Related to Traffic Accidents in Yazd City, Center of Iran (2016-2018). J Occup Health Epidemiol 2021; 10 (4) :231-238
URL: http://johe.rums.ac.ir/article-1-483-en.html
URL: http://johe.rums.ac.ir/article-1-483-en.html
Related article in
Google Scholar
Google Scholar
Similar articles
Mohammad Taghi Ghaneian1 

 , Azam Tarfiei *2 , Mohammad Hasan Ehrampoush1 , Mohammad Hasan Lotfi3 , Mahdieh Namayandeh4 , Ali Reza Adamizadeh5 , Naeimeh Keyghobdy6
, Azam Tarfiei *2 , Mohammad Hasan Ehrampoush1 , Mohammad Hasan Lotfi3 , Mahdieh Namayandeh4 , Ali Reza Adamizadeh5 , Naeimeh Keyghobdy6
1- Professor, Dept. of Human Ecology, Environmental Science and Technology Research Center, School of Public Health, Shahid Sadoughi University of Medical Sciences, Yazd, Iran.
2- MSc Student in Human Ecology, School of Public Health, Shahid Sadoughi University of Medical Sciences, Yazd, Iran. ,tarfieiaz@gmail.com
3- Professor, Dept. of Biostatistics and Epidemiology, Health Faculty, Shahid Sadoughi University of Medical Science, Yazd, Iran
4- Associated Prof., Dept. of Biostatistics and Epidemiology, Center of Health Care Data Modeling, School of Public Health, Shahid Sadoughi University of Medical Sciences, Yazd, Iran.
5- MSc in Traffic Management, Head of Traffic Education and Culture Department, Yazd, Iran.
6- MSc in Epidemiology, Dept. of Biostatistics Epidemiology, School of Public Health, Shahid Sadoughi University of Medical Science, Yazd, Iran.
2- MSc Student in Human Ecology, School of Public Health, Shahid Sadoughi University of Medical Sciences, Yazd, Iran. ,
3- Professor, Dept. of Biostatistics and Epidemiology, Health Faculty, Shahid Sadoughi University of Medical Science, Yazd, Iran
4- Associated Prof., Dept. of Biostatistics and Epidemiology, Center of Health Care Data Modeling, School of Public Health, Shahid Sadoughi University of Medical Sciences, Yazd, Iran.
5- MSc in Traffic Management, Head of Traffic Education and Culture Department, Yazd, Iran.
6- MSc in Epidemiology, Dept. of Biostatistics Epidemiology, School of Public Health, Shahid Sadoughi University of Medical Science, Yazd, Iran.
Article history

Received: 2021/10/15
Accepted: 2021/12/1
ePublished: 2021/12/25
Accepted: 2021/12/1
ePublished: 2021/12/25
Subject:
Epidemiology
Full-Text [PDF 323 kb]
(1274 Downloads)
| Abstract (HTML) (3856 Views)
Table 1. Frequency of traffic accidents according to demographic characteristics in Yazd during 2016-2018
The mean and standard deviation of the subjects' age was 35.3 ± 14.03 years (the mean and standard deviation of the age of the dead was 45.17 ± 37.12 and of the injured was 35.08 ± 13.89 years). The mean age of accidents leading to injuries and deaths was statistically significant (p =0.01). Out of the total number of accidents resulting in injuries, non-observance of the right to precede, sudden diversion, and lack of attention to the front accounted for 39%, 16.7%, and 14.7%, respectively. However, the highest death rate was related to high speed (31.2%) and non-observance of the right to precede (21.8%).
The results also showed no statistically significant difference between various accidents consequences (death, injury) at each level of inner-city roads (defective and non-defective roads) (p =0.4).
Given the lighting condition as an effective factor in the occurrence of accidents, it should be said that only driving at night was considered as a risk factor leading to death (p =0.005).
In this study, the rate of wearing and not wearing helmets and seat belts in the total number of occurred accidents was estimated to be 39.3%. According to the present study, people who did not use helmets and seat belts had higher death rates. Based on the statistical tests, there was a statistically significant relationship between death rate and not wearing a helmet or seat belt (p=0.005). The injury and death rates for those who did not have a driver's license or conditional license were 75.2% and 71.8%, respectively.
Among those who did not wear helmets and seat belts, young people (21-30 years old) had the highest percentage (32.9%). According to the results, there was a significant relationship between "age" and "commitment to wearing a seat belt" (p = 0.04). Moreover, deaths were reduced by 0.7% in people who wore seat belts. Also, 60.6% of those who wore helmets and seat belts were not injured, and the death rate in them was less than those who did not use safety equipment.
The highest traffic accidents were reported to be 80.7% on non-defective roads and 9.5% on roads with defects in infrastructure (Table 2). In this study, most accidents, 1266 cases (85.8%), occurred with non-defective vehicles, indicating that most people use such vehicles (Table 2).
A total of 918 traffic accidents were reported, 523 (57%) of which occurred in the streets, 79 (8.6%) in the alleys, and 316 (34.4%) in the boulevard, intersection, and square. Deaths in the streets were more than 4 times higher than in other places (Table 2).
Table 2. Distribution of absolute and relative vehicle frequency and factors
Regarding weather conditions, 1323 (89.3%) of the accidents were in clear air, and in terms of lighting conditions, 822 (55.4%) of the accidents occurred during the day. However, in terms of mortality, clear air had the highest death rate, 26 (81.3%). The highest incidence of death, with 12 (37.5%), occurred at night with sufficient light. The results showed that most traffic accidents occurred in spring (449/30.3%). While the fall had the highest death rate (12 /37.5%) compared to other seasons; however, the difference between the seasons was not significant. Most of the deaths occurred at the traffic accident scene (Table 3). In terms of time, the highest incidence of accidents was reported at 16-20, with the highest number of deaths and injuries. In contrast, the highest death rate was at 4-8, compared to the number of accidents (Table 3).
Table 3. Absolute and relative frequency distribution of climatic and time factors
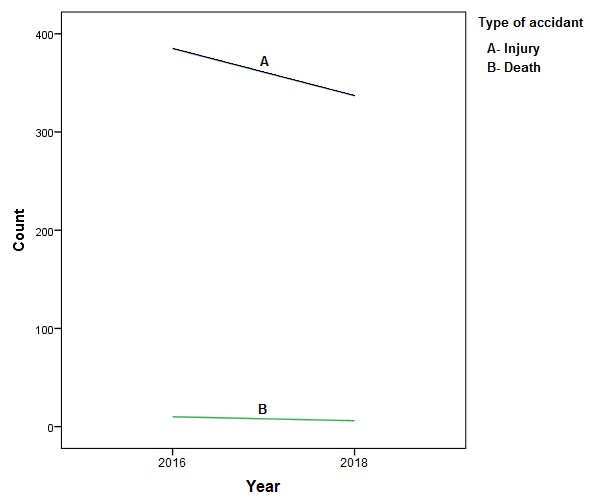
Fig. 1. Deaths and injuries caused by road traffic accidents during the period from 2016 to 2018 in the Yazd
Table 4. Adjusted p-value estimation based on all variables, gender, season, and seat belt using multiple logistic regression for the outcome of accidents
Discussion
Today, traffic accidents are one of the most common problems in societies affecting many health, social, and economic dimensions. This study found that most of the accidents were related to young drivers (16-30 years old) and the frequency of traffic accidents decreases by aging. High morbidity rates resulting from injuries in urban traffic accidents among young people were also observed in other studies [17, 18]. A study conducted in Thailand showed that 70% of deaths due to traffic accidents occurred in the young and working-age population [19]. In other studies, it was concluded that the traffic accident rate in people younger than 30 years was higher than in other age groups [20]. Considering the frequency of accidents in the present study, most of the accidents resulting in injuries occurred among young drivers, being consistent with other studies. This may be due to the fact that youth are active, inexperienced, and excited. The important point is that these accidents mostly affect males and young people who are the active group of society; thus, deaths in this age group can have negative socio-economic effects on society. Therefore, controlling and minimizing these deaths will have positive effects on society [21].
What is important among the findings of the study is the prevalence of injuries and deaths based on age. Indeed, it confirms the fact that young people aged 20-30 years (working age) are the main injured and people aged over 60 are the main deceased of traffic accidents. Therefore, according to the age composition of the population, the injury rate is high in this age group, which is consistent with other studies [22]. The results of this study showed that out of the total number of deaths from traffic accidents in Yazd during 2016-2018, 75% were males and 25% were females. Other studies in Iran and other countries have also had similar results and have considered gender as a risk factor for traffic accidents [23].
Investigations have indicated that the frequency of deaths in traffic accidents in Yazd city and also in Iran is higher in males than women, which may be due to their exposure to accidents, existing cultural issues, the economic role of men in the family, and allocating most jobs to men. Therefore, it is natural that men are more involved in these traffic accidents than women. However, other factors, such as women's greater caution, can also be addressed. In 2012, a study by CL Hanna in the United States showed that being male, along with factors such as young age, was associated with traffic accidents [18]. Prato et al. reported gender as an influential factor in high-risk driving behaviors in youth [24], which is in line with the present study.
In this study, the highest incidence of accidents was observed in diploma and high school education levels, possibly due to a large number of drivers with these degrees. A study conducted by Ahadi et al. in 2012 in Qazvin showed that drivers with higher education levels had the highest number of recorded accidents than those with a diploma, probably due to the lower use of vehicles by low-educated people. In total, drivers with diplomas had a large number of recorded accidents, regardless of their share of the total population [25]. Moreover, in traffic accidents, the presence of appropriate lighting to observe road conditions can be effective in reducing accidents [26]. The present study results showed that a higher percentage of accidents occurred during the day, which might be due to heavy traffic volume during the day. Some studies have reported night driving to be high risk due to decreased visual acuity, more common in older drivers [27].
In this study, the majority of accidents occurred in clear and sunny weather (93.4%). In a study, dust and high heat were the most important factors in the occurrence of accidents [28]. It could be due to the roads climate in different places, which can
play an effective role in the occurrence of traffic accidents in a particular area. Our results showed that about 39.3 % of people wore seat belts on urban routes, which is consistent with the study of Akbari et al. Wearing helmets and seat belts is one of the most effective ways to reduce the number of traffic accidents compared to other interventions. According to the documentation, the chance of being alive for a person wearing a seat belt is 5 times higher than a person who does not wear [29].
This study showed that the highest frequency among the complete causes was related to non-observance of priority rights, wrong turn, and sudden diversion, respectively. There is a statistically significant relationship between death and injury due to the complete cause, indicating the high importance of the complete cause factors. In a study, sudden diversion in urban areas of Iran with a ratio of 9.9 had the greatest impact on the death and injury consequences of traffic accidents [30], which is consistent with the results of the present study. In this study, most of the deaths were due to the high speed of the vehicle. The study results revealed that a 1% increase in speed was associated with a 2% increase in injuries and a 4% increase in deaths due to traffic accidents [31]. Moreover, most traffic accidents occurred in spring (32%), while the fall had the highest deaths percentage (37.5%). The high percentage of traffic accidents in spring is because of the high number of passengers in the city, probably due to the nature of city tourism.
On the other hand, in the fall, the death rate may be higher due to the reopening of schools and increased commuting. Interestingly, most traffic accidents occurred in the first 3 months of 2016-2018, probably due to the favorable weather conditions and high traffic densities in this city. The least percentage of accidents occurred in winter, which may be due to unfavorable weather conditions in this season, reducing traffic densities. Also, by adjusting the lighting condition in the accident occurrence, it was found that driving at night with sufficient light was more than without lighting. These results may be due to investigating inner-city accidents where most streets have sufficient light. At sunrise, deaths from traffic accidents are higher, while during the day, the chance of traffic accidents is higher than at other times. Soori et al. showed that the chance of an accident during the day is higher than at night, being in line with the present study [32]. The results showed that 60.6% of those who wore helmets and seat belts were not injured; also, the death rate among them was less than those who
did not use safety equipment.
In this study, among vehicles, SAIPA's Pride accounted for the highest rate of accidents, and the most injuries and deaths occurred among motorcyclists. Vlahogianni et al. indicated that the most vulnerable users of the transportation system were motorcyclists [33]. Non-observance of safe speed and safety regulations by motorcyclists, as well as not wearing a helmet, caused an increase in injuries and deaths in this group. The unavailability of further details of accidents was one of the limitations of this study. Also, the inconsistency of the total number of cases recorded for each of the variables in one year due to being undervalued by traffic police personnel was one of the difficulties of the data collection in the study. It is recommended to conduct research on road accidents in the form of interviews with people who have had the most accidents.
Conclusion
The results show that most people involved in the accidents are young men, while more death is among the old people; thus, this fact should be considered a priority in road safety interventions. Another phenomenon that aggravates traffic accidents is motorcycles, being used more because of easy transportation and not getting stuck in traffic. Pedestrians are among the most vulnerable groups. To reduce the damage and injuries of pedestrians, comprehensive and purposeful programs are needed. The identification of risk factors affecting the severity of accidents is essential for the development of safety countermeasures, the control of unauthorized speed, as well as the serious warning for the use of helmets and seat belts. Given the growing trend of transportation and the increase in traffic accidents with their consequences and the preventability of such accidents, it is necessary to take measures to ensure the safety of roads and vehicles, management procedures, training in traffic laws. Training drivers while certifying and informing them of the irreparable consequences of traffic accidents, as well as protecting vulnerable groups, help reduce casualties due to accidents.
Acknowledgement
Thanks are owed to Yazd Traffic Department members for their assistance. This study is the result of a research dissertation approved by the Vice-Chancellor for Research and Technology of the Yazd University of Medical Sciences.
Conflict of interest: None declared.
Full-Text: (1007 Views)
Introduction
One of the major public health concerns is traffic accidents worldwide [1]. The problem is multidimensional, with many risk factors being involved, including technical factors (vehicles), environmental factors (roads and infrastructure), human factors (road users), and their interactions [2]. Traffic accident injuries are one of the top ten causes of death globally [3]. Every year, more than 1.3 million people are killed on the roads worldwide, and 20 to 50 million people suffer from severe injuries. The consequences of traffic accidents will increase by about 65% over the next 20 years. In fact, the WHO predicts that accidents will become the fifth leading cause of death by 2030, accounting for 3.6% of all deaths worldwide [4]. The highest percentage (49%) of traffic accidents includes pedestrians and motorcyclists [5]. According to recent studies, nearly three-quarters of road deaths happen in developing and less developed countries (age group of 15-30) [6]. Although only 20% of the world vehicles are in poor and developing countries [7], the main cause of disability and untimely deaths [8] and 85% to 90% of lost years related to road accidents are in these countries [7]. Traffic accidents are the main cause of years of life lost and the second leading cause of death in Iran as a developing country [9-11]. Overall, it accounts for about 2.5% of the world's traffic accidents [12]. This amount reported in Iran is 20 times more than the industrialized countries and 5 times more than its counterparts [13]. Studies have shown that the most important causes of traffic accidents include high-risk behaviors, such as unauthorized speed ignoring traffic signs and regulations, unauthorized overtaking, fatigue and drowsiness while driving, the road's poor quality, and quantity of roads appropriate to the number of cars [14, 15].
According to the WHO report, the mortality rate due to traffic accidents in Iran is 32.1 per 100,000 people [4]. Since traffic accidents and their severe injuries and deaths are frequent in Iran, identification and evaluation of the problem and potential places are required for the necessary planning to prevent and control traffic accidents. The rate of accidents varies in different provinces of Iran. In 2015, the rate of road traffic accidents in Yazd city was estimated at 22.03%, which has decreased compared to previous years [16].
Road traffic accidents are a public health problem worldwide, especially in developing countries, including Iran. According to studies, such accidents have decreased in Yazd province; however, the rate of accidents is still higher than in many countries in the region and the world [16]. Given the importance of the issue and the need for health promotion in recent years, research efforts are needed to identify the factors associated with traffic accidents to protect people from fatal injuries and improve road safety. Therefore, the present study investigates the prevalence and factors related to traffic accidents leading to injuries or deaths in Yazd.
Materials and Methods
This was a descriptive study that examined the
causes of traffic accidents leading to injuries or deaths registered in traffic police accidents in Yazd city (during 2016-2018). Injury severity was classified into 2 levels: injury and fatal.
The data were collected using recorded checklists (accident information is recorded by traffic experts attending at the scene). All the cases related to traffic accidents in the traffic department were examined; regarding the principle of confidentiality, the information of injured and dead was extracted, and the files with incomplete information were excluded from the study. Out of 5600 cases of traffic accidents registered in Yazd, 1008 were investigated. After reviewing the files, 90 were excluded from the study due to incomplete information. Finally, 918 registered cases (including 1482 people involved in the accident) were investigated.
In this study, no specific entry and exit criteria were considered, and cases of injuries and deaths due to road traffic accidents in Yazd city were investigated.
Information about traffic accidents in checklist forms included crash time (hour, day, month, season, and year), location (main street, side street, three-way and crossroads, square, underpass, and alley), characteristics (outcome and type of collision), road characteristics and weather conditions ( lighting conditions, road defects, visual obstacles, road direction, exact accident position, rainy, and snowy), general characteristics (human and vehicle factors involved, spatial cause, and complete cause), vehicle details, on-site transit facilities, as well as details of injured and dead (drivers, passengers, pedestrians) and their demographic information (age, gender, occupation, and education).
There were three main occupational subgroups, including 1- simple (e.g., driver, worker, freelancer), 2- professional (e.g., military, employee), and 3- other (e.g., student, housewife).
Frequency, frequency percentage, mean, and standard deviation indices were used to describe the data. The normal distribution in quantitative variables was assessed by the Kolmogorov-Smirnov test. To compare the mean in the two independent groups, an independent t-test and chi-square were used. The correlation between some variables and deaths was analyzed using logistic regression. All analyses were conducted in SPSS software (version 20) with a significance level of 5%.
The information in this study was coded and obtained anonymously to be kept confidential. The ethics code of this article was IR.SSU.SPH.REC.1397.044.
Results
There were 1482 people involved in these accidents, including 17 (1.2%) cyclists, 445 (30%) motorcyclists, 131 (8.8%) pedestrians, 228 (15.4%) passengers, and 661 (44.6%) vehicle drivers. Out of the studied samples in traffic accidents, 97.8% (1450 cases) led to injury, and 2.2% (32 cases) led to death. Among the deaths, 17 (53.1%) were motorcyclists, and 11 (34.4%) were pedestrians.
The rate of injuries and deaths was 1218 cases (82.2%) in males and 264 cases (17.8%) in
females. Also, 1166 (78.7%) of the registered accidents occurred between the ages of 16 and 45 years.
Most of the recorded deaths in accidents were associated with the elderly (over 60 years), and injuries were associated with the age group of 16-30 years. Among the occupations, the most affected and dead groups were self-employed. The highest incidence of injuries and deaths in Yazd occurred in education levels of diploma and high school (Table 1).
Table 1. Frequency of traffic accidents according to demographic characteristics in Yazd during 2016-2018
| Demographic characteristics | Death | Injury | Deaths relative to the number of accidents | |
| Frequency (%) | Frequency (%) | (%) | ||
| Age | Under 16 | 0 | 48 (3.3) | 0 |
| 16-30 | 14 (43.75) | 652 (45) | 2.1 | |
| 31-45 | 10 (31.25) | 490 (33.8) | 2 | |
| 46-60 | 5 (15.62) | 199 (13.7) | 2.4 | |
| Above 60 | 3 (9.37) | 61 (4.2) | 5 | |
| Total | 32 (100) | 1450 (100) | - | |
| Gender | Male | 26 (81.25) | 1192 (82.2) | 2.1 |
| Female | 6 (18.75) | 258 (17.8) | 2.3 | |
| Total | 32 (100) | 1450 (100) | - | |
| Occupation | Unprofessional | 24 (75) | 1029 (71) | - |
| Professional | 2 (6.25) | 83 (5.7) | - | |
| Other | 6 (18.75) | 331 (22.82) | - | |
| Missing | 0 | 7 (0.48) | - | |
| Total | 32 (100) | 1450 (100) | - | |
| Educational level | High school | 20 (62.5) | 897 (61.9) | - |
| Diploma | 7 (21.9) | 351 (24.2) | - | |
| Academic | 5 (15.6) | 202 (13.9) | - | |
| Total | 32 (100) | 1450 (100) | - | |
The mean and standard deviation of the subjects' age was 35.3 ± 14.03 years (the mean and standard deviation of the age of the dead was 45.17 ± 37.12 and of the injured was 35.08 ± 13.89 years). The mean age of accidents leading to injuries and deaths was statistically significant (p =0.01). Out of the total number of accidents resulting in injuries, non-observance of the right to precede, sudden diversion, and lack of attention to the front accounted for 39%, 16.7%, and 14.7%, respectively. However, the highest death rate was related to high speed (31.2%) and non-observance of the right to precede (21.8%).
The results also showed no statistically significant difference between various accidents consequences (death, injury) at each level of inner-city roads (defective and non-defective roads) (p =0.4).
Given the lighting condition as an effective factor in the occurrence of accidents, it should be said that only driving at night was considered as a risk factor leading to death (p =0.005).
In this study, the rate of wearing and not wearing helmets and seat belts in the total number of occurred accidents was estimated to be 39.3%. According to the present study, people who did not use helmets and seat belts had higher death rates. Based on the statistical tests, there was a statistically significant relationship between death rate and not wearing a helmet or seat belt (p=0.005). The injury and death rates for those who did not have a driver's license or conditional license were 75.2% and 71.8%, respectively.
Among those who did not wear helmets and seat belts, young people (21-30 years old) had the highest percentage (32.9%). According to the results, there was a significant relationship between "age" and "commitment to wearing a seat belt" (p = 0.04). Moreover, deaths were reduced by 0.7% in people who wore seat belts. Also, 60.6% of those who wore helmets and seat belts were not injured, and the death rate in them was less than those who did not use safety equipment.
The highest traffic accidents were reported to be 80.7% on non-defective roads and 9.5% on roads with defects in infrastructure (Table 2). In this study, most accidents, 1266 cases (85.8%), occurred with non-defective vehicles, indicating that most people use such vehicles (Table 2).
A total of 918 traffic accidents were reported, 523 (57%) of which occurred in the streets, 79 (8.6%) in the alleys, and 316 (34.4%) in the boulevard, intersection, and square. Deaths in the streets were more than 4 times higher than in other places (Table 2).
Table 2. Distribution of absolute and relative vehicle frequency and factors
| Variable | Death | Injury | P-value | |
| Frequency (%) | Frequency (%) | |||
| Road defects | Road infrastructure | 3 (9.4) | 138 (9.5) | 0.47 |
| Traffic signs | 7 (21.9) | 98 (6.8) | ||
| Non-defective | 21 (65.6) | 11.74 (81) | ||
| Other | 1 (3.1) | 38 (2.6) | ||
| Missing | 0 | 2 (0.01) | ||
| Total | 32 (100) | 1450 (100) | ||
| Location | Street | 27 (74.37) | 810 (55.9) | 0.04* |
| Alley | 0 | 126 (8.7) | ||
| Boulevard, intersection, square | 5 (15.6) | 501 (34.5) | ||
| Missing | 0 | 13 (0.9) | ||
| Total | 32 (100) | 1450 (100) | ||
| Vehicle defects | Non-defective | 22 (68.8) | 1244 (85.8) | 0.049* |
| Defective | 9 (28.1) | 200 (13.8) | ||
| Missing | 1 (3.1) | 6 (0.4) | ||
| Total | 32 (100) | 1450 (100) | ||
* The level of significance was set at P<0.05.
Regarding weather conditions, 1323 (89.3%) of the accidents were in clear air, and in terms of lighting conditions, 822 (55.4%) of the accidents occurred during the day. However, in terms of mortality, clear air had the highest death rate, 26 (81.3%). The highest incidence of death, with 12 (37.5%), occurred at night with sufficient light. The results showed that most traffic accidents occurred in spring (449/30.3%). While the fall had the highest death rate (12 /37.5%) compared to other seasons; however, the difference between the seasons was not significant. Most of the deaths occurred at the traffic accident scene (Table 3). In terms of time, the highest incidence of accidents was reported at 16-20, with the highest number of deaths and injuries. In contrast, the highest death rate was at 4-8, compared to the number of accidents (Table 3).
Table 3. Absolute and relative frequency distribution of climatic and time factors
| Variable | Death | Injury | P-value | |
| Frequency (%) | Frequency (%) | |||
| Weather condition | Stormy and dusty | 5 (15.6) | 79 (5.5) | 0.04* |
| Snowy and rainy | 0 | 27 (1.9) | ||
| Clear | 26 (81.3) | 1297 (89.4) | ||
| Cloudy and foggy | 1 (3.1) | 47 (3.2) | ||
| Total | 32 (100) | 1450 (100) | ||
| Lighting condition | Day | 6 (18.7) | 816 (56.3) | 0.01* |
| Sun rise | 8 (25) | 154 (10.6) | ||
| Sunset | 4 (12.5) | 148 (10.2) | ||
| Night in full light | 12 (37.5) | 276 (19.03) | ||
| Night without lighting | 2 (6.25) | 56 (3.87) | ||
| Total | 32 (100) | 1450 (100) | ||
| Season | Spring | 5 (15.6) | 444(30.6) | 0.4 |
| Summer | 9 (28.1) | 368 (25.4) | ||
| Fall | 12 (37.5) | 348 (24) | ||
| Winter | 6 (18.7) | 284 (19.6) | ||
| Missing | 0 | 6 (0.4) | ||
| Total | 32 (100) | 1450 (100) | ||
| Time (hour) | 8-12 | 2 (6.2) | 318 (21.9) | 0.037* |
| 12-16 | 4 (12.5) | 346 (23.9) | ||
| 16-20 | 18 (56.2) | 413(28.5) | ||
| 20-24 | 2 (6.2) | 262 (18.1) | ||
| 0-4 | 0 | 24 (1.6) | ||
| 4-8 | 6 (18.7) | 87 (6) | ||
Fig. 1. Deaths and injuries caused by road traffic accidents during the period from 2016 to 2018 in the Yazd
According to Fig. 1, there was a decrease in the number of road traffic accidents leading to injuries and deaths from 2016 to 2018.
Vehicles (light) with 58% had the highest number of accidents, followed by motorcycles with 31.4%, pickup trucks with 6.4%, heavy vehicles with 2.6%, and bicycles with 1.6%, respectively. Among vehicles, SAIPA's Pride accounted for the highest rate of accidents (28.6%). A logistic regression model was used to investigate the relationship between seat belt, season, and sex with the accident consequence (death/injury). The crude OR and adjusted OR were calculated (Table 4). The results of the logistic regression model showed that the death odds ratio in men was almost 1.5 times higher than in women. This rate was not statistically significant. The accidents in spring, summer, and fall were more likely to cause death than in winter. However, the observed effects were not statistically significant.
Vehicles (light) with 58% had the highest number of accidents, followed by motorcycles with 31.4%, pickup trucks with 6.4%, heavy vehicles with 2.6%, and bicycles with 1.6%, respectively. Among vehicles, SAIPA's Pride accounted for the highest rate of accidents (28.6%). A logistic regression model was used to investigate the relationship between seat belt, season, and sex with the accident consequence (death/injury). The crude OR and adjusted OR were calculated (Table 4). The results of the logistic regression model showed that the death odds ratio in men was almost 1.5 times higher than in women. This rate was not statistically significant. The accidents in spring, summer, and fall were more likely to cause death than in winter. However, the observed effects were not statistically significant.
Table 4. Adjusted p-value estimation based on all variables, gender, season, and seat belt using multiple logistic regression for the outcome of accidents
| Covariate | OR | P-value | Adjusted OR* | P-value | |
| Gender | Male | 1.52 | 0.58 | 1.59 | 0.54 |
| Female | - | - | - | - | |
| Season | Spring | 1.97 | 0.559 | 1.96 | 0.563 |
| Summer | 5.58 | 0.110 | 5.48 | 0.114 | |
| Fall | 4.16 | 0.195 | 4.03 | 0.206 | |
| Winter | - | - | - | - | |
| Seatbelt use | Indeterminate | 0.40 | 0.392 | 0.45 | 0.456 |
| Yes | 1.14 | 0.806 | 1.16 | 0.772 | |
| No | - | - | - | - | |
*The level of significance was set at P<0.05.
Discussion
Today, traffic accidents are one of the most common problems in societies affecting many health, social, and economic dimensions. This study found that most of the accidents were related to young drivers (16-30 years old) and the frequency of traffic accidents decreases by aging. High morbidity rates resulting from injuries in urban traffic accidents among young people were also observed in other studies [17, 18]. A study conducted in Thailand showed that 70% of deaths due to traffic accidents occurred in the young and working-age population [19]. In other studies, it was concluded that the traffic accident rate in people younger than 30 years was higher than in other age groups [20]. Considering the frequency of accidents in the present study, most of the accidents resulting in injuries occurred among young drivers, being consistent with other studies. This may be due to the fact that youth are active, inexperienced, and excited. The important point is that these accidents mostly affect males and young people who are the active group of society; thus, deaths in this age group can have negative socio-economic effects on society. Therefore, controlling and minimizing these deaths will have positive effects on society [21].
What is important among the findings of the study is the prevalence of injuries and deaths based on age. Indeed, it confirms the fact that young people aged 20-30 years (working age) are the main injured and people aged over 60 are the main deceased of traffic accidents. Therefore, according to the age composition of the population, the injury rate is high in this age group, which is consistent with other studies [22]. The results of this study showed that out of the total number of deaths from traffic accidents in Yazd during 2016-2018, 75% were males and 25% were females. Other studies in Iran and other countries have also had similar results and have considered gender as a risk factor for traffic accidents [23].
Investigations have indicated that the frequency of deaths in traffic accidents in Yazd city and also in Iran is higher in males than women, which may be due to their exposure to accidents, existing cultural issues, the economic role of men in the family, and allocating most jobs to men. Therefore, it is natural that men are more involved in these traffic accidents than women. However, other factors, such as women's greater caution, can also be addressed. In 2012, a study by CL Hanna in the United States showed that being male, along with factors such as young age, was associated with traffic accidents [18]. Prato et al. reported gender as an influential factor in high-risk driving behaviors in youth [24], which is in line with the present study.
In this study, the highest incidence of accidents was observed in diploma and high school education levels, possibly due to a large number of drivers with these degrees. A study conducted by Ahadi et al. in 2012 in Qazvin showed that drivers with higher education levels had the highest number of recorded accidents than those with a diploma, probably due to the lower use of vehicles by low-educated people. In total, drivers with diplomas had a large number of recorded accidents, regardless of their share of the total population [25]. Moreover, in traffic accidents, the presence of appropriate lighting to observe road conditions can be effective in reducing accidents [26]. The present study results showed that a higher percentage of accidents occurred during the day, which might be due to heavy traffic volume during the day. Some studies have reported night driving to be high risk due to decreased visual acuity, more common in older drivers [27].
In this study, the majority of accidents occurred in clear and sunny weather (93.4%). In a study, dust and high heat were the most important factors in the occurrence of accidents [28]. It could be due to the roads climate in different places, which can
play an effective role in the occurrence of traffic accidents in a particular area. Our results showed that about 39.3 % of people wore seat belts on urban routes, which is consistent with the study of Akbari et al. Wearing helmets and seat belts is one of the most effective ways to reduce the number of traffic accidents compared to other interventions. According to the documentation, the chance of being alive for a person wearing a seat belt is 5 times higher than a person who does not wear [29].
This study showed that the highest frequency among the complete causes was related to non-observance of priority rights, wrong turn, and sudden diversion, respectively. There is a statistically significant relationship between death and injury due to the complete cause, indicating the high importance of the complete cause factors. In a study, sudden diversion in urban areas of Iran with a ratio of 9.9 had the greatest impact on the death and injury consequences of traffic accidents [30], which is consistent with the results of the present study. In this study, most of the deaths were due to the high speed of the vehicle. The study results revealed that a 1% increase in speed was associated with a 2% increase in injuries and a 4% increase in deaths due to traffic accidents [31]. Moreover, most traffic accidents occurred in spring (32%), while the fall had the highest deaths percentage (37.5%). The high percentage of traffic accidents in spring is because of the high number of passengers in the city, probably due to the nature of city tourism.
On the other hand, in the fall, the death rate may be higher due to the reopening of schools and increased commuting. Interestingly, most traffic accidents occurred in the first 3 months of 2016-2018, probably due to the favorable weather conditions and high traffic densities in this city. The least percentage of accidents occurred in winter, which may be due to unfavorable weather conditions in this season, reducing traffic densities. Also, by adjusting the lighting condition in the accident occurrence, it was found that driving at night with sufficient light was more than without lighting. These results may be due to investigating inner-city accidents where most streets have sufficient light. At sunrise, deaths from traffic accidents are higher, while during the day, the chance of traffic accidents is higher than at other times. Soori et al. showed that the chance of an accident during the day is higher than at night, being in line with the present study [32]. The results showed that 60.6% of those who wore helmets and seat belts were not injured; also, the death rate among them was less than those who
did not use safety equipment.
In this study, among vehicles, SAIPA's Pride accounted for the highest rate of accidents, and the most injuries and deaths occurred among motorcyclists. Vlahogianni et al. indicated that the most vulnerable users of the transportation system were motorcyclists [33]. Non-observance of safe speed and safety regulations by motorcyclists, as well as not wearing a helmet, caused an increase in injuries and deaths in this group. The unavailability of further details of accidents was one of the limitations of this study. Also, the inconsistency of the total number of cases recorded for each of the variables in one year due to being undervalued by traffic police personnel was one of the difficulties of the data collection in the study. It is recommended to conduct research on road accidents in the form of interviews with people who have had the most accidents.
Conclusion
The results show that most people involved in the accidents are young men, while more death is among the old people; thus, this fact should be considered a priority in road safety interventions. Another phenomenon that aggravates traffic accidents is motorcycles, being used more because of easy transportation and not getting stuck in traffic. Pedestrians are among the most vulnerable groups. To reduce the damage and injuries of pedestrians, comprehensive and purposeful programs are needed. The identification of risk factors affecting the severity of accidents is essential for the development of safety countermeasures, the control of unauthorized speed, as well as the serious warning for the use of helmets and seat belts. Given the growing trend of transportation and the increase in traffic accidents with their consequences and the preventability of such accidents, it is necessary to take measures to ensure the safety of roads and vehicles, management procedures, training in traffic laws. Training drivers while certifying and informing them of the irreparable consequences of traffic accidents, as well as protecting vulnerable groups, help reduce casualties due to accidents.
Acknowledgement
Thanks are owed to Yazd Traffic Department members for their assistance. This study is the result of a research dissertation approved by the Vice-Chancellor for Research and Technology of the Yazd University of Medical Sciences.
Conflict of interest: None declared.
References
1. Tegegne KT. Prevalence of Road Traffic Accidents and Associated Factors in Chuko Town, Southern Ethiopia, 2017. J Occu Health Epidemiol 2020; 9(2):76-84. [DOI]
2. Boulagouas W, García-Herrero S, Chaib R, Febres JD, Mariscal MÁ, Djebabra M. An Investigation into Unsafe Behaviors and Traffic Accidents Involving Unlicensed Drivers: A Perspective for Alignment Measurement. Int J Environ Res Public Health 2020; 17(18):6743. [DOI] [PMID] [PMCID]
3. Benlagha N, Charfeddine L. Risk factors of road accident severity and the development of a new system for prevention: New insights from China. Accid Anal Prev 2020; 136:105411. [DOI] [PMID]
4. World Health Organization. Global status report on road safety 2018. Geneva, Switzerland: World Health Organization; 2018. [Report]
5. Char F, Serre T. Analysis of pre-crash characteristics of passenger car to cyclist accidents for the development of advanced drivers assistance systems. Accid Anal Prev 2020; 136:105408. [DOI] [PMID]
6. Mansuri FA, Al-Zalabani AH, Zalat MM, Qabshawi RI. Road safety and road traffic accidents in Saudi Arabia: A systematic review of existing evidence. Saudi Med J 2015; 36(4):418-24. [DOI] [PMID] [PMCID]
7. Pérez-Chada D, Videla AJ, O'Flaherty ME, Palermo P, Meoni J, Sarchi MI, et al. Sleep habits and accident risk among truck drivers: a cross-sectional study in Argentina. Sleep 2005; 28(9):1103-8. [DOI] [PMID]
8. Azami-Aghdash S, Sadeghi-Bazarghani H, Rezapour R, Heydari M, Derakhshani N. Comparative Study of Stewardship of Road Traffic Injuries Prevention with a Focus on the Role of Health System; Three Pioneer Countries and Three Similar to Iran. Bull Emerg Trauma 2019; 7(3):212-22. [DOI] [PMID] [PMCID]
9. Nazmfar H, Eshghei Char Borj A, Alavi S, Jasaraty A. Spatial analysis of road accidents resulting in death approach to climate Case Study: Ardabil Province. Geogr Data 2017; 26(103):83-97. [DOI]
10. Nasiri N, Nazari P, Kamali A, Sharifi A, Sharifi H. Factors contributing to fatal road traffic accidents in the South of Kerman during the period from 2013 to 2017, Iran. J Occu Health Epidemiol 2019; 8(1):6-11 [DOI]
11. Kazemzadeh Y, Oroji MA, Didehdar M, Nazari J, Pishvar M, Moazeni M, et al. Incidence Rate and Epidemiological Aspects of Injuries Due to Accidents in Khomein City, Iran (2018). J Occu Health Epidemiol 2020; 9(3):133-9. [DOI]
12. Heidari M, Aryankhesal A, Khorasani-Zavareh D. Laypeople roles at road traffic crash scenes: a systematic review. Int J Inj Contr Saf Promot 2019; 26(1):82-91. [DOI] [PMID]
13. Majdzadeh R, Feiz-Zadeh A, Rajabpour Z, Motevalian A, Hosseini M, Abdollahi M, et al. Opium consumption and the risk of traffic injuries in regular users: a case-crossover study in an emergency department. Traffic Inj Prev 2009; 10(4):325-9. [DOI] [PMID]
14. Zeynali S, Hosseinali F, Sadeghi Niaraki A, Kazemi Beydokhti M, Effati M. Spatial Analysis of Accidents at the Suburban Intersections Using Kernel Density Estimation and Spatial Autocorrelation Methods. J Geospat Inf Technol 2015; 3(2):21-42. [DOI]
15. Murphy P, Morris A. Quantifying accident risk and severity due to speed from the reaction point to the critical conflict in fatal motorcycle accidents. Accid Anal Prev 2020; 141:105548. [DOI] [PMID]
16. Lotfi MH, Lashkardoost H, Hamedi A. Fatal road traffic accidents in Yazd province, Iran during 2011-2015. J Emerg Pract Trauma 2019; 5(2):51-5. [DOI]
17. de Melo WA, Alarcão AC, de Oliveira AP, Pelloso SM, Carvalho MD. Age-related risk factors with nonfatal traffic accidents in urban areas in Maringá, Paraná, Brazil. Traffic Inj Prev 2017; 18(2):157-63. [DOI] [PMID]
18. Hanna CL, Laflamme L, Bingham CR. Fatal crash involvement of unlicensed young drivers: county level differences according to material deprivation and urbanicity in the United States. Accid Anal Prev 2012; 45:291-5. [DOI] [PMID]
19. Suriyawongpaisal P, Kanchanasut S. Road traffic injuries in Thailand: trends, selected underlying determinants and status of intervention. Inj Control Saf Promot 2003; 10(1-2):95-104. [DOI] [PMID]
20. Jafari MJ, Barkhordari A, Eskandari D, Mehrabi Y. Relationships between certain individual characteristics and occupational accidents. Int J Occup Saf Ergon 2019; 25(1):61-5. [DOI] [PMID]
21. Mahmoudi G, Abdi Talarposhti. Investigating Frequency and Factors Affecting Traffic Accidents Leading to Injury or Death in the Selected Hospitals of Mazandaran Province, in 2013. Saf Promot Inj Prev 2018; 5(3):148-56.
22. Al Reesi H, Al Maniri A, Adawi SA, Davey J, Armstrong K, Edwards J. Prevalence and characteristics of road traffic injuries among young drivers in Oman, 2009–2011. Traffic Inj Prev 2016; 17(5):480-7. [DOI] [PMID]
23. Ako E. Impact of Road Safety and Accidents Prevention in Cameroon [Internet]. 2019. doi: 10.2139/ssrn.3404589. Available from: https://ssrn.com/abstract=3404589 [DOI]
24. Prato CG, Toledo T, Lotan T, Taubman-Ben-Ari O. Modeling the behavior of novice young drivers during the first year after licensure. Accid Anal Prev 2010; 42(2):480-6. [DOI] [PMID]
25. Ahadi M, Moghadam GF. Analysis of accident data within the city and provide solutions to reduce losses. Transport Technol 2012; 7(19):25-32.
26. 26. Boyce PR. Lighting for Driving: Roads, Vehicles, Signs, and Signals. 1st ed. Boca Raton, Florida, United States: CRC Press; 2008. [DOI]
27. 27. Konstantopoulos P, Chapman P, Crundall D. Driver's visual attention as a function of driving experience and visibility. Using a driving simulator to explore drivers’ eye movements in day, night and rain driving. Accid Anal Prev 2010; 42(3):827-34. [DOI] [PMID]
28. 28. Mohammadi H, Mahmoudi P. Climatic Effect on Car Crashes on Sanandaj-Hamedan Road. Geography and Regional Development 2006; 3(6):129-54.
29. 29. Akbari ME, Naghavi M, Soori H. Epidemiology of deaths from injuries in the Islamic Republic of Iran. East Mediterr Health J 2006; 12(3-4):382-90. [Article]
30. 30. Bakhtiyari M, Mehmandar MR, Mirbagheri B, Hariri GR, Delpisheh A, Soori H. An epidemiological survey on road traffic crashes in Iran: application of the two logistic regression models. Int J Inj Contr Saf Promot 2014; 21(2):103-9. [DOI] [PMID]
31. 31. Aarts L, van Schagen I. Driving speed and the risk of road crashes: A review. Accid Anal Prev 2006; 38(2):215-24. [DOI] [PMID]
32. 32. Khosravi Shadmani F, Soori H, Ainy E, Zayeri F, Mehmandar MR. Comparison of Road Traffic Death Occurrence within Urban and Metropolitan Roads Focusing on Environmental Factors. Hakim Health Sys Res 2013; 15(4):339-45. [Article]
Send email to the article author
| Rights and permissions | |
 |
This work is licensed under a Creative Commons Attribution 4.0 International License. |
